Akamai Technologies AKAM
Since 1998, Akamai has developed and provided solutions for global enterprises to build, secure and accelerate their applications and digital experiences. 10-K, Item 1
- Employees
- 11,000
- Headquarters
- Cambridge, MA
- Next results
- around Feb 18, 2027
Where each dollar of revenue went, FY2025
Revenue of $4.2B through the costs to a net profit of $452.0M · income statement of the 10-K
AKAM among Technology peers
Six ratios from the latest 10-K. Each corner is the share of 74 peers the company is above, not a score.
What changed
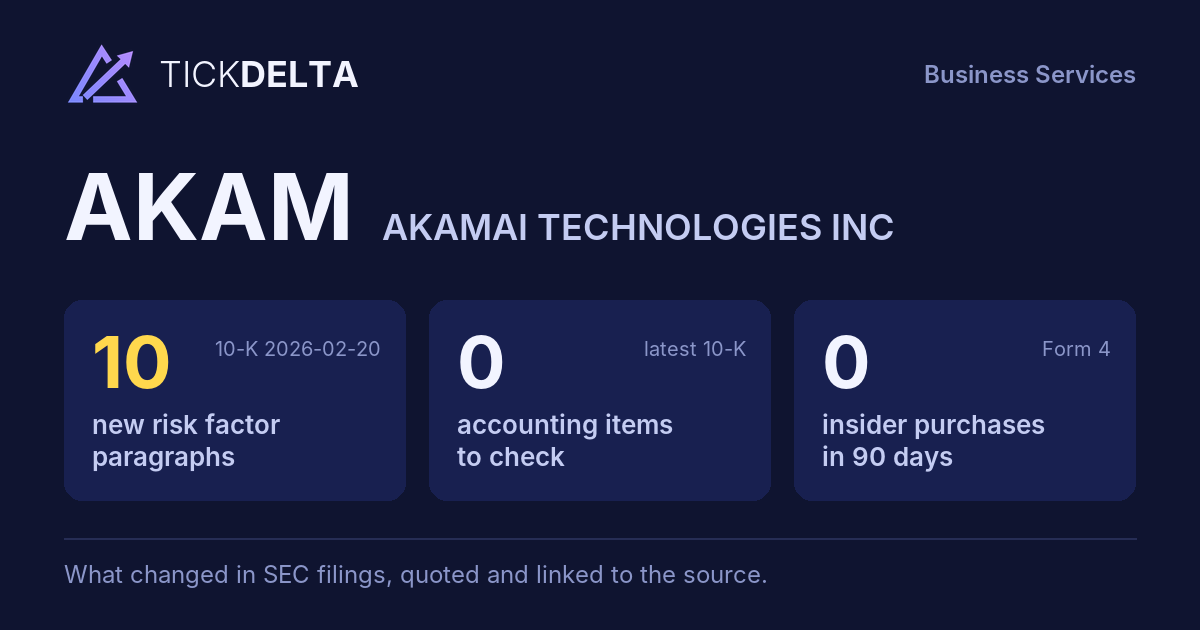
10 new risk paragraphs. 10-K filed Feb 20, 2026 against Feb 24, 2025.
Each row opens the detail with the quote and the filing. A row is a change worth reading, not a verdict.
Accounting checks
10 checks on the latest 10-K. Checks, not verdicts.
0facts worth reading about all 10 checks found nothing to note
-
Receivables +9.1% vs revenue +5.4% (+3.6 pts)
-
Cash from operations $1.5B vs net income $452.0M (FY ending Dec 31, 2025)
-
Same auditor in both 10-Ks: PricewaterhouseCoopers LLP
7 more checks with nothing to note
-
No statement of substantial doubt about going concern
-
No 8-K item 4.02 in the last 2 years
-
No NT 10-K or NT 10-Q in the last 2 years
-
No longer listed: Acquisition of Noname Gate Ltd. - Valuation of Completed Technologies; Table of Content s. Same as last year: Revenue Recognition
-
No sentence in the 10-K concludes that controls were not effective because of a material weakness
-
No 8-K item 2.06 in the last 2 years
-
No 8-K item 1.03 in the last 2 years
In their words
10 paragraphs in Risk Factors that were not in the 10-K filed Feb 24, 2025. Quoted as filed.
-
Item 1A · new paragraph · not in the 10-K filed Feb 24, 2025 10-K, ITEM 1A
Our contracts may not contain limitations of liability, and even where they do, there can be no assurance that such terms are sufficient to protect us from liabilities, damages, or claims related to our privacy and data security obligations. Further, although we maintain cyber liability insurance, this insurance may not provide adequate…
-
Item 1A · new paragraph · not in the 10-K filed Feb 24, 2025 10-K, ITEM 1A
A significant portion of our hiring, new customers and revenue growth in recent years has been attributable to our business outside the U.S. Our operations in international countries subject us to risks that may increase our costs, impact our financial results, disrupt our operations or make our operations less efficient and require…
-
Item 1A · new paragraph · not in the 10-K filed Feb 24, 2025 10-K, ITEM 1A
Certain jurisdictions are adopting or tightening data localization and data residency requirements that restrict where customer or employee data may be stored, processed, accessed or encrypted. In the U.S., regulators are increasingly scrutinizing and restricting certain personal data transfers and transactions involving foreign…
-
Item 1A · new paragraph · not in the 10-K filed Feb 24, 2025 10-K, ITEM 1A
On January 22, 2026, the divestiture was finalized, and a new U.S.-based joint venture assumed operation of the U.S. application. Although the divestiture has been completed, certain aspects of the transaction could be subject to future governmental review or litigation. Further, it is difficult to predict whether any future…
New risk paragraphs, against peers
Latest 10-K of each, Technology companies closest in revenue
Paragraphs in Risk Factors with nothing like them in the company's 10-K the year before. A count of text, not of risk.
From the same starting line, FY2016 to FY2025
Revenue, net income and free cash flow, each set to 100 in FY2016. What happened, from the 10-Ks. Not a forecast.
Financial performance
Last 4 fiscal years · 10-K XBRL
| Metric | FY2022 | FY2023 | FY2024 | FY2025 |
|---|---|---|---|---|
| Revenue | $3.6B | $3.8B | $4.0B | $4.2B |
| Net income | $523.7M | $547.6M | $504.9M | $452.0M |
| Operating cash flow | $1.3B | $1.3B | $1.5B | $1.5B |
| Free cash flow | $1.0B | $890.5M | $1.1B | $1.0B |
Revenue, FY2016 to FY2025
Ten fiscal years, each from its own 10-K · XBRL · USD
$4.2B ▲ 5.4% in FY2025$452.0M ▼ 10.5% in FY2025$1.0B ▼ 10.4% in FY2025
Recent filings
6 filings in the last 30 days · SEC EDGAR
-
8-KNov 12, 2026Material agreement signed, New debt or obligation, Unregistered share sale, Regulation FD disclosure 8-K items 1.01, 2.03, 3.02, 7.01
-
8-KNov 10, 2026Other events 8-K item 8.01
-
8-KNov 9, 2026Material agreement signed, New debt or obligation, Other events 8-K items 1.01, 2.03, 8.01
-
10-QNov 6, 2026Quarterly report (10-Q) period ended Sep 30, 2026
-
8-KNov 5, 2026Quarterly results 8-K item 2.02
About the company
Akamai Technologies, Cambridge, MA · from the 10-K filed Feb 20, 2026
Since 1998, Akamai has developed and provided solutions for global enterprises to build, secure and accelerate their applications and digital experiences. As of December 31, 2025, our massively distributed global infrastructure was comprised of core and distributed compute sites, more than 4,300 edge points-of-presence in over 130 countries and approximately 700 cities, and our underlying global network integrated with roughly 1,200 network partners. With this scale and distribution, Akamai has visibility and insight into traffic volumes, congestion, attack patterns, vulnerabilities and other activities across the internet's complex intersections of networks and systems.
- Headquarters
- Cambridge, MA
- Country
- United States
- Listed on
- Nasdaq
- Fiscal year ends
- December 31
- Last results
- Nov 5, 2026
- Incorporated in
- DE
Employees, at the top of the page: "As of December 31, 2025, we had over 11,000 employees located in more than 30 countries (with approximately 65% of those employees located outside of the U" (10-K). Address and exchange: SEC's company file.
Email alerts
Sources
The 10-K filed Feb 20, 2026 (open at SEC), compared with the 10-K filed Feb 24, 2025. Numbers from the XBRL of the 10-Ks; filings from SEC EDGAR.
Work with it: Excel workbook · CSV. Google Sheet that stays up to date: paste =IMPORTDATA("https://tickdelta.com/company/AKAM/export.csv") into a cell.