Advanced Micro Devices AMD
The statements in this report include forward-looking statements within the meaning of the Private Securities Litigation Reform Act of 1995. 10-K, Item 1
- Employees
- 31,000
- Headquarters
- Santa Clara, CA
- CEO
- Lisa T. Su
- Next results
- around Feb 2, 2027
Where each dollar of revenue went, FY2025
Revenue of $34.6B through the costs to a net profit of $4.3B · income statement of the 10-K
AMD among Technology peers
Six ratios from the latest 10-K. Each corner is the share of 74 peers the company is above, not a score.
What changed
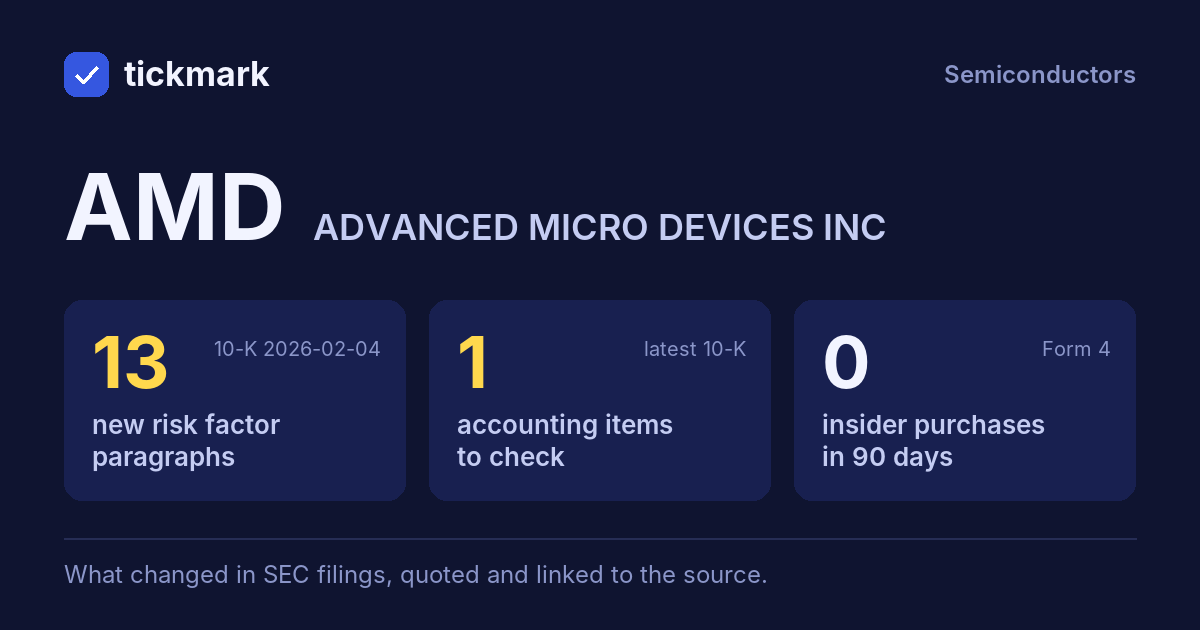
13 new risk paragraphs and 1 accounting fact worth reading about. 10-K filed Feb 4, 2026 against Feb 5, 2025.
Each row opens the detail with the quote and the filing. A row is a change worth reading, not a verdict.
Accounting checks
11 checks on the latest 10-K. Checks, not verdicts.
1fact worth reading about the other 10 checks found nothing to note
-
Critical audit matters changedNew this year: Table of Conten t s (“At December 27, 2025, the Company’s net inventory balance was $7,920 million. As discussed in Note 2 to the consolidated financial statements, the Company adjusts the inventory carrying value to the lower of actual cost or the estimated net realizable value after completing ongoing reviews of on-han”). Same as last year: Inventory Valuation
-
Receivables +2.0% vs revenue +34.3% (-32.4 pts)
9 more checks with nothing to note
-
Cash from operations $7.7B vs net income $4.3B (FY ending Dec 27, 2025)
-
Inventory +38.1% vs revenue +34.3% (+3.8 pts)
-
Same auditor in both 10-Ks: Ernst & Young LLP
-
No statement of substantial doubt about going concern
-
No 8-K item 4.02 in the last 2 years
-
No NT 10-K or NT 10-Q in the last 2 years
-
No sentence in the 10-K concludes that controls were not effective because of a material weakness
-
No 8-K item 2.06 in the last 2 years
-
No 8-K item 1.03 in the last 2 years
In their words
13 paragraphs in Risk Factors that were not in the 10-K filed Feb 5, 2025. Quoted as filed.
-
Item 1A · new paragraph · not in the 10-K filed Feb 5, 2025 10-K, ITEM 1A
Competition is expected to remain intense, driven by rapid technological change, evolving standards, shifting customer preferences, product obsolescence, and frequent product launches from both established and new competitors. Some of our competitors may possess stronger market positions, larger customer bases, more design wins, and…
-
Item 1A · new paragraph · not in the 10-K filed Feb 5, 2025 10-K, ITEM 1A
In addition, strategic partnerships, acquisitions and business collaborations by and between our competitors may increase competition and adversely affect our business. For example, in September 2025, Nvidia announced a partnership and investment in Intel to partner on new data center and client platform products. This partnership may…
-
Item 1A · new paragraph · not in the 10-K filed Feb 5, 2025 10-K, ITEM 1A
Product transition risks may increase as the computing industry shifts toward shorter launch cycles and a broader range of accelerated computing platforms. Product transitions are complex and as such we may ship both new and prior-generation products concurrently. Customer adoption patterns can vary and while some customers may shift to…
-
Item 1A · new paragraph · not in the 10-K filed Feb 5, 2025 10-K, ITEM 1A
Our business and the business of our suppliers and customers may also be subject to current and future climate-related regulations, contract terms and lawsuits. Increased regulations on carbon taxes, greenhouse gas emissions, fuel or energy taxes will likely result in greater costs, such as through carbon pricing impact on utilities or…
New risk paragraphs, against peers
Latest 10-K of each, Technology companies closest in revenue
Paragraphs in Risk Factors with nothing like them in the company's 10-K the year before. A count of text, not of risk.
Financial performance
Last 4 fiscal years · 10-K XBRL
| Metric | FY2022 | FY2023 | FY2024 | FY2025 |
|---|---|---|---|---|
| Revenue | $23.6B | $22.7B | $25.8B | $34.6B |
| Net income | $1.3B | $854.0M | $1.6B | $4.3B |
| Operating cash flow | $3.6B | $1.7B | $3.0B | $7.7B |
| Free cash flow | $3.1B | $1.1B | $2.4B | $6.7B |
Revenue, FY2016 to FY2025
Ten fiscal years, each from its own 10-K · XBRL · USD
$34.6B ▲ 34.3% in FY2025$4.3B ▲ 164.2% in FY2025$6.7B ▲ 180.0% in FY2025
Recent filings
2 filings in the last 30 days · SEC EDGAR
-
10-QNov 4, 2026Quarterly report (10-Q) period ended Sep 26, 2026
-
8-KNov 3, 2026Quarterly results, Regulation FD disclosure 8-K items 2.02, 7.01
About the company
Advanced Micro Devices, Santa Clara, CA · from the 10-K filed Feb 4, 2026
The statements in this report include forward-looking statements within the meaning of the Private Securities Litigation Reform Act of 1995. These forward-looking statements are based on current expectations and beliefs and involve numerous risks and uncertainties that could cause actual results to differ materially from expectations. These forward-looking statements speak only as of the date hereof or as of the dates indicated in the statements and should not be relied upon as predictions of future events, as we cannot assure you that the events or circumstances reflected in these statements will be achieved or will occur.
- Headquarters
- Santa Clara, CA
- Country
- United States
- Listed on
- Nasdaq
- Fiscal year ends
- December 26
- Last results
- Nov 3, 2026
- Incorporated in
- DE
Employees, at the top of the page: "As of December 27, 2025, we had approximately 31,000 employees in our global workforce" (10-K). Address and exchange: SEC's company file.
Email alerts
Sources
The 10-K filed Feb 4, 2026 (open at SEC), compared with the 10-K filed Feb 5, 2025. Numbers from the XBRL of the 10-Ks; filings from SEC EDGAR.
Work with it: Excel workbook · CSV. Google Sheet that stays up to date: paste =IMPORTDATA("https://tickdelta.com/company/AMD/export.csv") into a cell.