Amphenol APH
- Employees
- 170,000
- Headquarters
- Wallingford, CT
- CEO
- Richard Adam Norwitt
- Next results
- around Jan 27, 2027
Where each dollar of revenue went, FY2025
Revenue of $23.1B through the costs to a net profit of $4.3B · income statement of the 10-K
APH among Technology peers
Six ratios from the latest 10-K. Each corner is the share of 74 peers the company is above, not a score.
What changed
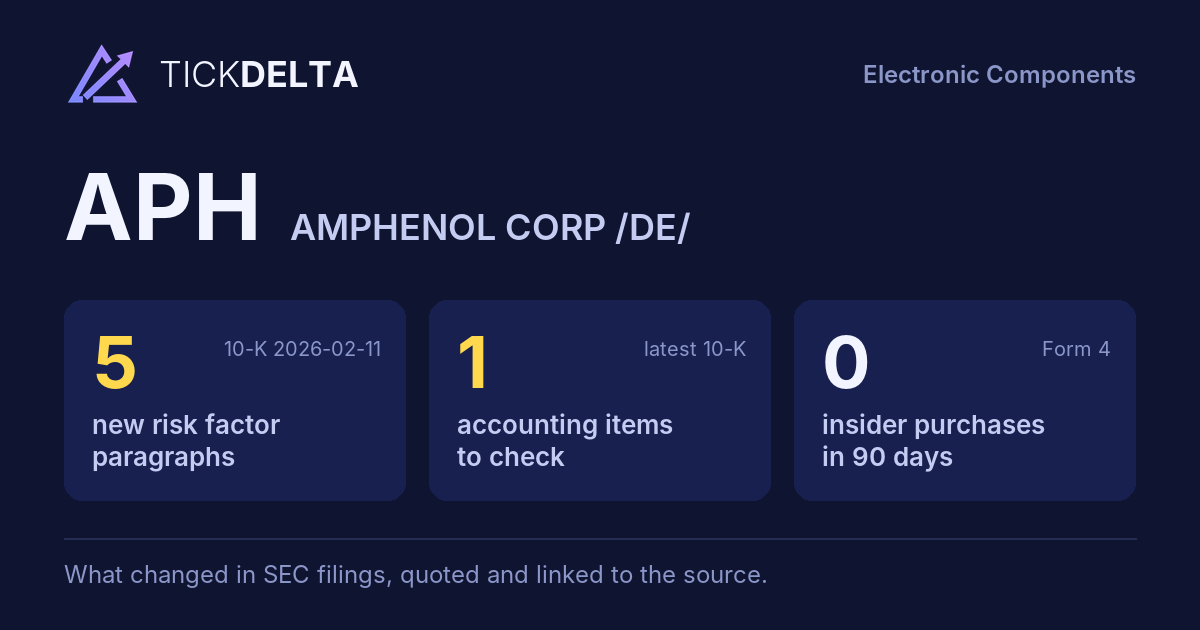
5 new risk paragraphs and 1 accounting fact worth reading about. 10-K filed Feb 11, 2026 against Feb 7, 2025.
Each row opens the detail with the quote and the filing. A row is a change worth reading, not a verdict.
Accounting checks
11 checks on the latest 10-K. Checks, not verdicts.
1fact worth reading about the other 10 checks found nothing to note
-
Critical audit matters changedNew this year: Determining if there is any relevant additional information available that was not identified and considered in management’s assessment (“o Assessing the technical merits of a sample of positions identified and the reasonableness of the methodology used to determine the unrecognized tax benefit.”). No longer listed: Reviewing other available relevant information. Same as last year: Income Taxes - Unrecognized Tax Benefits; Evaluating former and ongoing tax audits and notices by tax authorities; Evaluating transactions for which third-party tax advice or tax opinions were received
-
Receivables +43.5% vs revenue +51.7% (-8.2 pts)
9 more checks with nothing to note
-
Cash from operations $5.4B vs net income $4.3B (FY ending Dec 31, 2025)
-
Inventory +34.5% vs revenue +51.7% (-17.2 pts)
-
Same auditor in both 10-Ks: Deloitte & Touche LLP
-
No statement of substantial doubt about going concern
-
No 8-K item 4.02 in the last 2 years
-
No NT 10-K or NT 10-Q in the last 2 years
-
No sentence in the 10-K concludes that controls were not effective because of a material weakness
-
No 8-K item 2.06 in the last 2 years
-
No 8-K item 1.03 in the last 2 years
In their words
5 paragraphs in Risk Factors that were not in the 10-K filed Feb 7, 2025. Quoted as filed.
-
Item 1A · new paragraph · not in the 10-K filed Feb 7, 2025 10-K, ITEM 1A
In the course of operating our business, we and certain of our third-party providers collect, maintain and process data about customers, employees, suppliers and others, including personally identifiable information. We are therefore subject to a variety of laws, regulations and other requirements relating to information security and…
-
Item 1A · new paragraph · not in the 10-K filed Feb 7, 2025 10-K, ITEM 1A
Financing a portion of the consideration of the CommScope acquisition resulted in an increase in the Company’s debt and interest expense, which could adversely affect the Company’s results of operations, cash flows and financial condition. Financing a portion of the consideration of the CommScope acquisition resulted in a significant…
-
Item 1A · new paragraph · not in the 10-K filed Feb 7, 2025 10-K, ITEM 1A
In 2025, certain of the Company’s subsidiaries based in China received notices from relevant tax authorities challenging certain of the Company’s tax positions taken over up to an eight-year period. Although the Company believes its tax positions are appropriate and is currently discussing the matter with the relevant tax authorities,…
-
Item 1A · new paragraph · not in the 10-K filed Feb 7, 2025 10-K, ITEM 1A
On July 4, 2025, the U.S. federal government enacted the tax and spending bill H.R. 1. This legislation contains changes to previously enacted provisions of the Internal Revenue Code and provides for extensions of certain expiring tax provisions included in the Tax Cuts and Jobs Act. Certain corporate tax provisions in H.R. 1 were…
New risk paragraphs, against peers
Latest 10-K of each, Technology companies closest in revenue
Paragraphs in Risk Factors with nothing like them in the company's 10-K the year before. A count of text, not of risk.
Financial performance
Last 4 fiscal years · 10-K XBRL
| Metric | FY2022 | FY2023 | FY2024 | FY2025 |
|---|---|---|---|---|
| Revenue | $12.6B | $12.6B | $15.2B | $23.1B |
| Net income | $1.9B | $1.9B | $2.4B | $4.3B |
| Operating cash flow | $2.2B | $2.5B | $2.8B | $5.4B |
| Free cash flow | $1.8B | $2.2B | $2.1B | $4.4B |
Revenue, FY2016 to FY2025
Ten fiscal years, each from its own 10-K · XBRL · USD
$23.1B ▲ 51.7% in FY2025$4.3B ▲ 76.2% in FY2025$4.4B ▲ 103.7% in FY2025
Recent filings
2 filings in the last 30 days · SEC EDGAR
-
10-QOct 30, 2026Quarterly report (10-Q) period ended Sep 30, 2026
-
8-KOct 28, 2026Quarterly results, Other events 8-K items 2.02, 8.01
About the company
Amphenol, Wallingford, CT · from the 10-K filed Feb 11, 2026
Amphenol Corporation is one of the world’s largest designers, manufacturers and marketers of electrical, electronic and fiber optic connectors and interconnect systems, antennas, sensors and sensor-based products and coaxial, high-speed, fiber optic and specialty cable. The Company estimates, based on recent reports of industry analysts, that worldwide sales of interconnect, value-add cable assembly, antenna, cable and sensor-related products were approximately $500 billion in 2025.
- Headquarters
- Wallingford, CT
- Country
- United States
- Listed on
- NYSE
- Fiscal year ends
- December 31
- Last results
- Oct 28, 2026
- Incorporated in
- DE
Employees, at the top of the page: "As of December 31, 2025, the Company had approximately 170,000 employees worldwide, of which approximately 15,000 were located in the United States" (10-K). Address and exchange: SEC's company file.
Email alerts
Sources
The 10-K filed Feb 11, 2026 (open at SEC), compared with the 10-K filed Feb 7, 2025. Numbers from the XBRL of the 10-Ks; filings from SEC EDGAR.
Work with it: Excel workbook · CSV. Google Sheet that stays up to date: paste =IMPORTDATA("https://tickdelta.com/company/APH/export.csv") into a cell.