Form 10-K
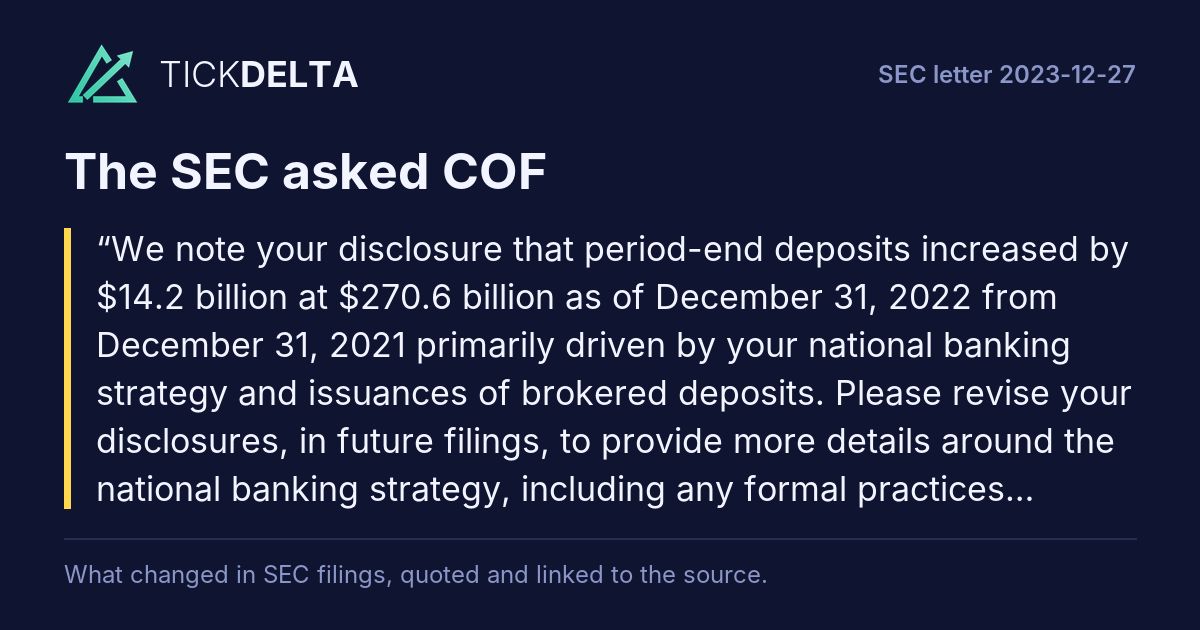
We note your disclosure that period-end deposits increased by $14.2 billion at $270.6 billion as of December 31, 2022 from December 31, 2021 primarily driven by your national banking strategy and issuances of brokered deposits. Please revise your disclosures, in future filings, to provide more details around the national banking strategy, including any formal practices, guidelines, etc.Rest of the question
which would allow an investor to understand the strategy and any related risks/trends. In addition, include discussion of any related impacts the brokered deposits have on your funding costs, net interest margin and to the extent applicable, whether you have policies or internal limits regarding concentrations in brokered deposits and / or uninsured deposits, in total or by type of depositor, and whether you have complied with any such internal requirements for the periods presented.
The Company respectfully acknowledges the Staff’s comment. As discussed with the Staff, our national banking strategy has been in place for more than a decade and is focused on providing banking products primarily through digital channels and through our cafe and branch locations. This hybrid model of digital and physical customer engagement, supported by our brand and marketing strategy, has grown our banking franchise, leading to robust consumer deposit growth over this period. We provide disclosures about this strategy more generally in Item 1. Business - Overview,
Item 1.Read in the reply ↗Rest of the answer
Business - Operations and Business Segments and Item 1. Business - Competition in our Form 10-K. Risks associated with operating an online direct bank are described in Item 1A. Risk Factors.
To the extent our national banking strategy is identified in our MD&A as a driver of consumer deposit growth, we will include a more detailed reference to that strategy, such as:
“...primarily driven by our national banking strategy, which includes our national brand and marketing strategy, Capital One Cafes, and tech / digital investments, which have enabled us to both deepen and grow the overall customer base for Capital One.”
Our primary source of funding comes from deposits, as they are a stable and relatively low cost source of funding. The majority of our deposit base is with retail consumers and within FDIC insurance limits. In addition to consumer and commercial deposits, we seek to maintain a diversified mix of available funding sources through wholesale channels, of which brokered deposits is one component. Other components include senior and subordinated notes, securitized debt obligations, and Federal Home Loan Bank (“FHLB”) advances. Through our Liquidity Adequacy Framework, we monitor and ensure the diversification of these funding sources.
While brokered deposits were identified as one of the drivers of the increase in overall deposits between December 31, 2021 and December 31, 2022, they are a relatively modest funding source for the Company in total and the increase between these two periods largely represented a return to the funding composition levels of recent history. Brokered deposits provided 5% of our total funding as of December 31, 2019 and December 31, 2020, respectively, decreased to 3% as of December 31, 2021, and rose back to those prior levels as of December 31, 2022, and September 30, 2023, respectively.
The cost of these deposits approximate the cost of alternative wholesale funding sources such as securitizations. Therefore, the impact of brokered deposits on our overall funding costs and net interest margin is not significant for the periods noted. In the event brokered deposits become a more significant funding source and/or have a significant impact on our overall funding costs or net interest margin, we would provide corresponding additional disclosure.
While we have not set explicit concentration targets regarding uninsured or brokered deposits, we manage our funding sources and associated product strategies in such a way as to place the highest preference on FDIC-insured consumer deposits, while maintaining access to a diversified mix of funding sources. This preference is reflected in our public disclosures around uninsured deposits, which we have provided in our 2021 and 2022 Form 10-Ks, as well as each Form 10-Q during
2023. These disclosures show that our uninsured deposit base decreased from 29.5% of total deposits as of December 31, 2021 to 24% as of December 31, 2022, and has decreased further to 20% as of September 30, 2023.
First report after the company's reply of 2024-01-25: 10-K filed 2024-02-23 ↗, against the 10-K filed 2023-02-24 ↗.
Tickdelta does not hold the text of both reports, so they are not compared here.
Please disclose a table summarizing your total available sources of liquidity, by type of borrowing capacity, showing total borrowing capacity less borrowings outstanding to arrive at remaining capacity, then adding in other sources of liquidity such as cash, securities, etc. to arrive at total available liquidity, or tell us where this information is disclosed in the aggregate.
the Staff’s comment and understands from our discussion with the Staff that the Staff’s objective is to ensure readers of our financial statements are able to efficiently derive aggregated information around liquidity and borrowing capacity and that a table is one example of how to present that information succinctly.
We have extensive disclosures about our borrowing capacity and available sources of liquidity in the MD&A sections of our annual and quarterly reports under Liquidity
Risk Profile. However, this information is not disclosed in summary form.Read in the reply ↗Rest of the answer
Therefore, in future filings we will enhance our disclosures by including a summary description of these amounts in the aggregate at the beginning of the Liquidity Risk Profile section and reference to the more detailed disclosures on these matters we already provide. A draft of this summary description is included below using information as of December 31, 2022:
We manage our funding and liquidity risk in an integrated manner in support of the current and future cash flow needs of our business. We maintained liquidity reserves of
$106.6 billion and $116.6 billion as of December 31, 2022 and 2021, respectively, as shown in Table 30 below. Included in liquidity reserves are cash and cash equivalents, investment securities, and FHLB borrowing capacity secured by loans.
As of December 31, 2022, we had available issuance capacity of $33.1 billion through our credit card and auto loan securitization programs. We are also able to issue an indeterminate amount of senior or subordinated debt securities, preferred stock, depositary shares, common stock, purchase contracts, warrants and units. Our ability to issue under each shelf registration is subject to market conditions.
Finally, as of December 31, 2022, we had access to available contingent liquidity sources totaling $45.8 billion through pledged collateral, including a portion of the investment securities included in the liquidity reserve amount above, at the Federal Reserve Discount Window, the Fixed Income Clearing
Corporation - Government Securities Division (“FICC—GSD") and the Federal Home Loan Bank (“FHLB”).
As of December 31, 2022 and 2021, our funding sources totaled $381.7 billion and $354.1 billion, respectively, primarily comprised of consumer deposits, as shown in Table
6 above.
Our liquidity reserves, borrowing capacity, contingent liquidity sources and total funding sources are all discussed in more detail in the following sections.
[Our existing “Liquidity Risk
Profile” disclosures would commence hereafter]
Cited Tables for Reference
Table
30 below presents the composition of our liquidity reserves as of December 31, 2022 and 2021.
Table 30: Liquidity Reserves
(Dollars in million)
December 31, 2022
December 31, 2021
Cash and cash equivalents
$ 30,856
$ 21,746
Investment securities available for sale, at fair value
76,919
95,261
FHLB borrowing capacity secured by loans
6,436
7,109
Outstanding FHLB advances and letters of credit secured by loans and investment securities
(51 )
(8 )
Other encumbrances of investment securities
(7,583 )
(7,874 )
Total liquidity reserves
$ 106,577
$ 116,234
6 provides the composition of our primary sources of funding as of December 31, 2022 and 2021.
6: Funding Sources Composition
Amount
% of Total
Deposits:
Consumer Banking
$ 270,592
71 %
$ 256,407
72 %
Commercial Banking
40,808
44,809
Other(1)
21,592
9,764
Total deposits
332,992
310,980
Securitized debt obligations
16,973
14,994
Other debt
31,742
28,092
Total funding sources
$ 381,707
100 %
$ 354,066
_______________
(1)
Includes brokered deposits of $20.6 billion and $8.6 billion as of December 31, 2022 and 2021, respectively.
First report after the company's reply of 2024-01-25: 10-K filed 2024-02-23 ↗, against the 10-K filed 2023-02-24 ↗.
Tickdelta does not hold the text of both reports, so they are not compared here.
We note your disclosures discussing various key assumptions associated with your net interest income sensitivity and economic value of equity sensitivity. The assumptions for your net interest income sensitivity include loan and deposit growth and pricing, and plans for projected changes in funding mix in your baseline forecast.Rest of the question
Key assumptions used in the calculation of your economic value of equity sensitivity measure include projecting rate sensitive prepayments for mortgage securities, loans and other assets, term structure modeling of interest rates, discount spreads, and deposit volume and pricing assumptions. Please revise your disclosures, in future filings, to fully describe and define the various identified inputs and assumptions supporting your market risk presentations and sensitivity disclosures. In addition, provide a discussion of how any assumptions have changed from period to period, including any changes to the data source used or significant changes in the actual assumption itself.
the Staff’s comment. In future filings, we will expand our existing disclosure of our key assumptions used to calculate net interest income and economic value of equity sensitivity to more fulsomely describe them. We will also provide disclosure of any significant changes to our models or key assumptions from period to period, whether from a change in the assumption itself, change in data source or change in methodology for estimating the assumption.
The draft disclosures which follow reproduce in full the proposed enhancement of key assumptions for both our net interest income and economicRead in the reply ↗Rest of the answer
value of equity sensitivity:
Net Interest Income Sensitivity
Our net interest income sensitivity measure estimates the impact of hypothetical instantaneous movements in interest rates relative to our baseline interest rate forecast on our forecasted 12-month net interest income. Net interest income sensitivity metrics are derived using the following key assumptions:
● In addition to our existing assets and liabilities, including derivatives, we incorporate expected future business growth assumptions, such as loan and deposit growth and pricing, and plans for projected changes in our funding mix and our securities and cash position from our internal corporate outlook that is used in our financial planning process.
● The analysis assumes this forecast of expected future business growth remains unchanged between the baseline rate forecast and rate shock scenarios, including no changes to our interest rate risk management activities like securities and hedging actions.
● We incorporate the dynamic nature of deposit repricing, which includes pricing lags and changes in deposit beta and mix as interest rates change, and the prepayment sensitivity of our mortgage securities to the level of interest rates.
In our models, deposit betas and mortgage security prepayments vary dynamically based on the level of interest rates and by product type.
● Where applicable, U.S. dollar interest rates are floored at 0.00%.
[...]
Economic
Value of Equity Sensitivity
Our economic value of equity sensitivity measure estimates the impact of hypothetical instantaneous movements in interest rates on the net present value of our existing assets and liabilities, including derivative exposures. Economic value of equity sensitivity metrics are derived using the following key assumptions:
● The analysis includes only existing assets and liabilities, including derivatives, and does not incorporate business growth assumptions or projected balance sheet changes.
● Similar to our net interest income sensitivity measure, we incorporate the dynamic nature of deposit repricing and attrition, which includes pricing lags and changes in deposit beta as interest rates change and the prepayment sensitivity of our mortgage securities to the level of interest rates. In our models, deposit betas and mortgage security prepayments vary dynamically based on the level of interest rates and by product type.
● Balance attrition assumptions for loans, including Credit Card, Auto and Commercial loans, remain unchanged between the baseline interest rate forecast and interest rate shock scenarios as those loans are mainly floating rate or shorter duration fixed rate loans and hence paydowns have a low sensitivity to the level of interest rates.
● For assets and liabilities with embedded optionality, such as mortgage securities and deposit balances, we utilize monte carlo simulations to assess economic value with industry-standard term structure modeling of interest rates.
● Our calculations of net present value apply appropriate spreads over the benchmark yield curve for select assets and liabilities to capture the inherent risks (including credit risk) to discount expected interest and principal cash flows.
First report after the company's reply of 2024-01-25: 10-K filed 2024-02-23 ↗, against the 10-K filed 2023-02-24 ↗.
Tickdelta does not hold the text of both reports, so they are not compared here.
We note your disclosure and references to deposit beta as part of your net interest income and economic value of equity sensitivity analyses, which indicates that it increased compared to December 31, 2022. Please expand your disclosures, in future filings, to quantify and discuss changes in your deposit beta and/or cumulative deposit beta between periods presented, to the extent that it is monitored and used byRest of the question
management, as well as a more fulsome discussion of how the metric is calculated. In this regard, we noted commentary during your third quarter of 2023 earnings call discussing your cumulative beta.
the Staff’s comment and will expand disclosure in future filings to include a discussion of changes in cumulative deposit beta for the comparative periods when such changes are an important factor in understanding changes in net interest income or net interest margin in the Consolidated Results of Operations section of MD&A.Read in the reply ↗Rest of the answer
Net interest margin was the context in which we provided the referenced commentary on our third quarter of 2023 earnings call and the discussion of changes in our observed cumulative deposit beta between comparative periods aligns with the same discussion we provide for net interest income and net interest margin in this section of our Form 10-Qs and
Form 10-Ks. Where cumulative beta is presented, a definition of how it is calculated will accompany it.
A draft of this disclosure enhancement is excerpted below using information as of September 30, 2023:
Our cumulative deposit beta increased to 57% as of September 30, 2023 from 35% as of December 31, 2022 primarily driven by product mix shifts toward higher rate products, deposit pricing lags relative to increases in market interest rates and competition. We define cumulative deposit beta as the ratio of changes in the rate paid on our interest-bearing deposits to the increases in the upper limit of the Fed Funds rate during the current rising interest rate cycle.
First report after the company's reply of 2024-01-25: 10-K filed 2024-02-23 ↗, against the 10-K filed 2023-02-24 ↗.
Tickdelta does not hold the text of both reports, so they are not compared here.
Also in this review: request for more time, 2024-01-09, closing letter, 2024-02-01