Costco COST
Costco Wholesale Corporation and its subsidiaries (Costco or the Company) began operations in 1983, in Seattle, Washington. 10-K, Item 1
- Employees
- 355,000
- Headquarters
- Issaquah, WA
- CEO
- Roland Michael Vachris
- Next results
- around Dec 10, 2026
Where each dollar of revenue went, FY2026
Revenue of $303.2B through the costs to a net profit of $9.2B · income statement of the 10-K
COST among Consumer staples peers
Six ratios from the latest 10-K. Each corner is the share of 32 peers the company is above, not a score.
What changed
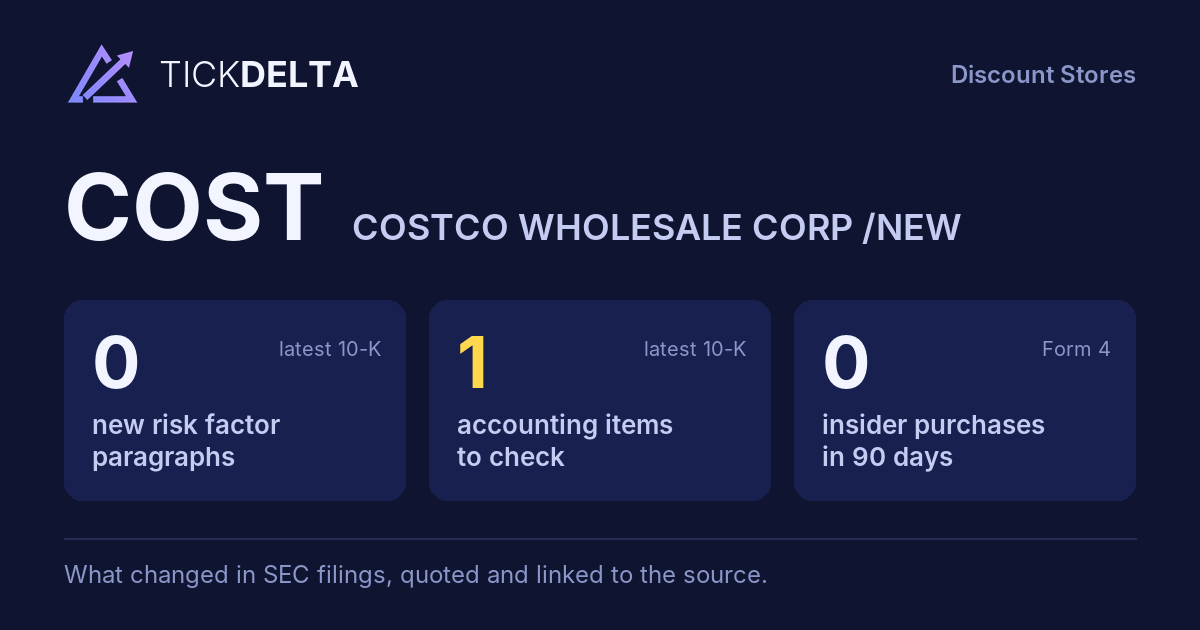
1 accounting fact worth reading about.
Each row opens the detail with the quote and the filing. A row is a change worth reading, not a verdict.
Accounting checks
11 checks on the latest 10-K. Checks, not verdicts.
1fact worth reading about the other 10 checks found nothing to note
-
Receivables growing faster than revenueReceivables +23.6% vs revenue +10.1% (+13.5 pts)
-
Cash from operations $15.8B vs net income $9.2B (FY ending Aug 30, 2026)
9 more checks with nothing to note
-
Inventory +6.7% vs revenue +10.1% (-3.5 pts)
-
Same auditor in both 10-Ks: KPMG LLP
-
No statement of substantial doubt about going concern
-
No 8-K item 4.02 in the last 2 years
-
No NT 10-K or NT 10-Q in the last 2 years
-
The same matters as last year: Sufficiency of audit evidence over United States and Canada revenue
-
No sentence in the 10-K concludes that controls were not effective because of a material weakness
-
No 8-K item 2.06 in the last 2 years
-
No 8-K item 1.03 in the last 2 years
In their words
No new paragraphs in Risk Factors
No new paragraphs in Risk Factors, or fewer than two 10-Ks to compare.
New risk paragraphs, against peers
Latest 10-K of each, Consumer staples companies closest in revenue
Paragraphs in Risk Factors with nothing like them in the company's 10-K the year before. A count of text, not of risk.
Financial performance
Last 4 fiscal years · 10-K XBRL
| Metric | FY2023 | FY2024 | FY2025 | FY2026 |
|---|---|---|---|---|
| Revenue | $242.3B | $254.5B | $275.2B | $303.2B |
| Net income | $6.3B | $7.4B | $8.1B | $9.2B |
| Operating cash flow | $11.1B | $11.3B | $13.3B | $15.8B |
| Free cash flow | $6.7B | $6.6B | $7.8B | $9.4B |
Revenue, FY2017 to FY2026
Ten fiscal years, each from its own 10-K · XBRL · USD
$303.2B ▲ 10.1% in FY2026$9.2B ▲ 13.9% in FY2026$9.4B ▲ 19.7% in FY2026
Recent filings
2 filings in the last 30 days · SEC EDGAR
-
8-KNov 10, 2026Director or officer change, Other events 8-K items 5.02, 8.01
-
8-KOct 16, 2026Director or officer change 8-K item 5.02
About the company
Costco, Issaquah, WA · from the 10-K filed Oct 7, 2026
Costco Wholesale Corporation and its subsidiaries (Costco or the Company) began operations in 1983, in Seattle, Washington. We are principally engaged in the operation of membership warehouses in the United States (U.S.) and Puerto Rico, Canada, Mexico, Japan, the United Kingdom (U.K.), Korea, Australia, Taiwan, China, Spain, France, Sweden, Iceland, and New Zealand. Costco operated 939, 914, and 890 warehouses worldwide at August 30, 2026, August 31, 2025, and September 1, 2024. The Company operates e-commerce sites in the U.S., Canada, Mexico, the U.K., Korea, Taiwan, Japan, Australia, and China. Our common stock trades on the NASDAQ Global Select Market, under the symbol “COST.”
- Headquarters
- Issaquah, WA
- Country
- United States
- Reports in
- USD
- Listed on
- Nasdaq
- Fiscal year ends
- August 30
- Last results
- Sep 24, 2026
- Incorporated in
- WA
Employees, at the top of the page: "At the end of 2026, we employed 355,000 employees worldwide" (10-K). Address and exchange: SEC's company file.
Email alerts
Sources
Numbers from the XBRL of the 10-Ks; filings from SEC EDGAR.
Work with it: Excel workbook · CSV. Google Sheet that stays up to date: paste =IMPORTDATA("https://tickdelta.com/company/COST/export.csv") into a cell.