Marvell Technology MRVL
Marvell Technology, Inc., together with its consolidated subsidiaries (“Marvell,” “MTI,” the “Company,” “we,” or “us”) is a leading supplier of data infrastructure semiconductor solutions, spanning the data center core to network edge. 10-K, Item 1
- Employees
- 7,480
- Headquarters
- Wilmington, DE
- CEO
- Matthew J. Murphy
- Next results
- around Mar 4, 2027
Where each dollar of revenue went, FY2026
Revenue of $8.2B through the costs to a net profit of $2.7B · income statement of the 10-K
MRVL among Technology peers
Six ratios from the latest 10-K. Each corner is the share of 74 peers the company is above, not a score.
What changed
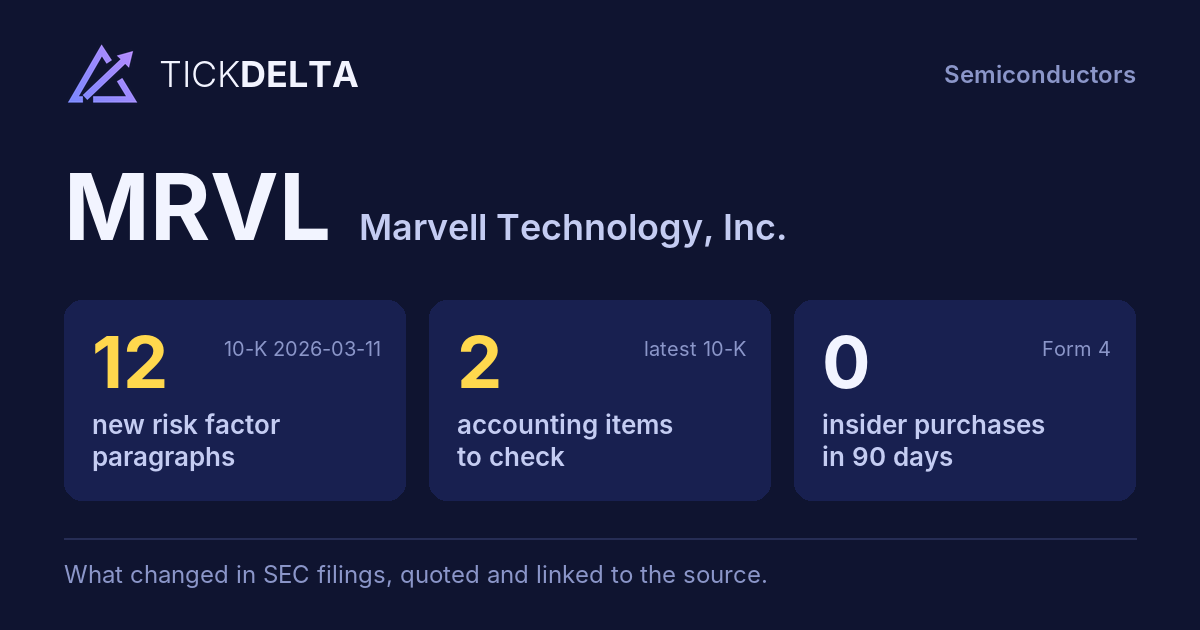
12 new risk paragraphs and 2 accounting facts worth reading about. 10-K filed Mar 11, 2026 against Mar 12, 2025.
Each row opens the detail with the quote and the filing. A row is a change worth reading, not a verdict.
Accounting checks
10 checks on the latest 10-K. Checks, not verdicts.
2facts worth reading about the other 8 checks found nothing to note
-
Receivables growing faster than revenueReceivables +112.6% vs revenue +42.1% (+70.5 pts)
-
Cash from operations lower than net incomeCash from operations $1.8B vs net income $2.7B (FY ending Jan 31, 2026)
-
Inventory +34.8% vs revenue +42.1% (-7.3 pts)
7 more checks with nothing to note
-
Same auditor in both 10-Ks: Deloitte & Touche LLP
-
No statement of substantial doubt about going concern
-
No 8-K item 4.02 in the last 2 years
-
No NT 10-K or NT 10-Q in the last 2 years
-
No sentence in the 10-K concludes that controls were not effective because of a material weakness
-
No 8-K item 2.06 in the last 2 years
-
No 8-K item 1.03 in the last 2 years
In their words
12 paragraphs in Risk Factors that were not in the 10-K filed Mar 12, 2025. Quoted as filed.
-
Item 1A · new paragraph · not in the 10-K filed Mar 12, 2025 10-K, ITEM 1A
Rapid advances in artificial intelligence (“AI”) and machine learning (“ML”) technologies, including generative AI, could fundamentally alter the semiconductor industry and disrupt our business model and operations. AI-driven tools and platforms are increasingly being deployed across the integrated circuit (“IC”) development lifecycle,…
-
Item 1A · new paragraph · not in the 10-K filed Mar 12, 2025 10-K, ITEM 1A
In addition to the above risks related to economic conditions, the U.S. has implemented a series of tariffs targeting various nations and industries. These announcements have triggered global reactions, affecting markets, slowing global economic growth, and heightening concerns about broader financial instability. Tariffs and…
-
Item 1A · new paragraph · not in the 10-K filed Mar 12, 2025 10-K, ITEM 1A
In 2025, U.S. government interactions with U.S. semiconductor companies implied that as a condition to obtaining and maintaining export licenses for certain products and technologies destined for China, they remit to the U.S. government a fee equal to fifteen percent (15%) of the gross revenue derived from such China-related sales. In…
-
Item 1A · new paragraph · not in the 10-K filed Mar 12, 2025 10-K, ITEM 1A
On April 14, 2025, the BIS announced the initiation of investigations into the effects on U.S. national security of imports of semiconductors under Section 232 of the Trade Expansion Act of 1962. The scope of the investigation includes semiconductors, semiconductor manufacturing equipment, and their derivative products including…
New risk paragraphs, against peers
Latest 10-K of each, Technology companies closest in revenue
Paragraphs in Risk Factors with nothing like them in the company's 10-K the year before. A count of text, not of risk.
From the same starting line, FY2020 to FY2026
Revenue, net income and free cash flow, each set to 100 in FY2020. What happened, from the 10-Ks. Not a forecast.
Financial performance
Last 4 fiscal years · 10-K XBRL
| Metric | FY2023 | FY2024 | FY2025 | FY2026 |
|---|---|---|---|---|
| Revenue | $5.9B | $5.5B | $5.8B | $8.2B |
| Net income | −$163.5M | −$933.4M | −$885.0M | $2.7B |
| Operating cash flow | $1.3B | $1.4B | $1.7B | $1.8B |
| Free cash flow | $1.1B | $1.0B | $1.4B | $1.4B |
Revenue, FY2020 to FY2026
Ten fiscal years, each from its own 10-K · XBRL · USD
$8.2B ▲ 42.1% in FY2026$2.7B in FY2026$1.4B ▲ 0.0% in FY2026
Recent filings
3 filings in the last 30 days · SEC EDGAR
-
8-KNov 2, 2026Quarterly results, Regulation FD disclosure 8-K items 2.02, 7.01
-
8-KNov 2, 2026Material agreement signed 8-K item 1.01
-
8-KOct 23, 2026Material agreement signed 8-K item 1.01
About the company
Marvell Technology, Wilmington, DE · from the 10-K filed Mar 11, 2026
Marvell Technology, Inc., together with its consolidated subsidiaries (“Marvell,” “MTI,” the “Company,” “we,” or “us”) is a leading supplier of data infrastructure semiconductor solutions, spanning the data center core to network edge. We are a fabless supplier of high-performance semiconductor products with core strengths in developing and scaling complex System-on-a-Chip architectures, integrating analog, mixed-signal and digital signal processing functionality.
- Headquarters
- Wilmington, DE
- Country
- United States
- Reports in
- USD
- Listed on
- Nasdaq
- Fiscal year ends
- January 30
- Last results
- Nov 2, 2026
- Incorporated in
- DE
Employees, at the top of the page: "The Company employed 7,480 people as of January 31, 2026" (10-K). Address and exchange: SEC's company file.
Email alerts
Sources
The 10-K filed Mar 11, 2026 (open at SEC), compared with the 10-K filed Mar 12, 2025. Numbers from the XBRL of the 10-Ks; filings from SEC EDGAR.
Work with it: Excel workbook · CSV. Google Sheet that stays up to date: paste =IMPORTDATA("https://tickdelta.com/company/MRVL/export.csv") into a cell.