Micron Technology MU
We are a global leader in semiconductor memory and storage, powering AI and compute-intensive applications from cloud to edge. 10-K, Item 1
- Employees
- 61,000
- Headquarters
- Boise, ID
- CEO
- Sanjay Mehrotra
- Next results
- around Dec 16, 2026
Where each dollar of revenue went, FY2026
Revenue of $133.2B through the costs to a net profit of $85.0B · income statement of the 10-K
MU among Technology peers
Six ratios from the latest 10-K. Each corner is the share of 74 peers the company is above, not a score.
What changed
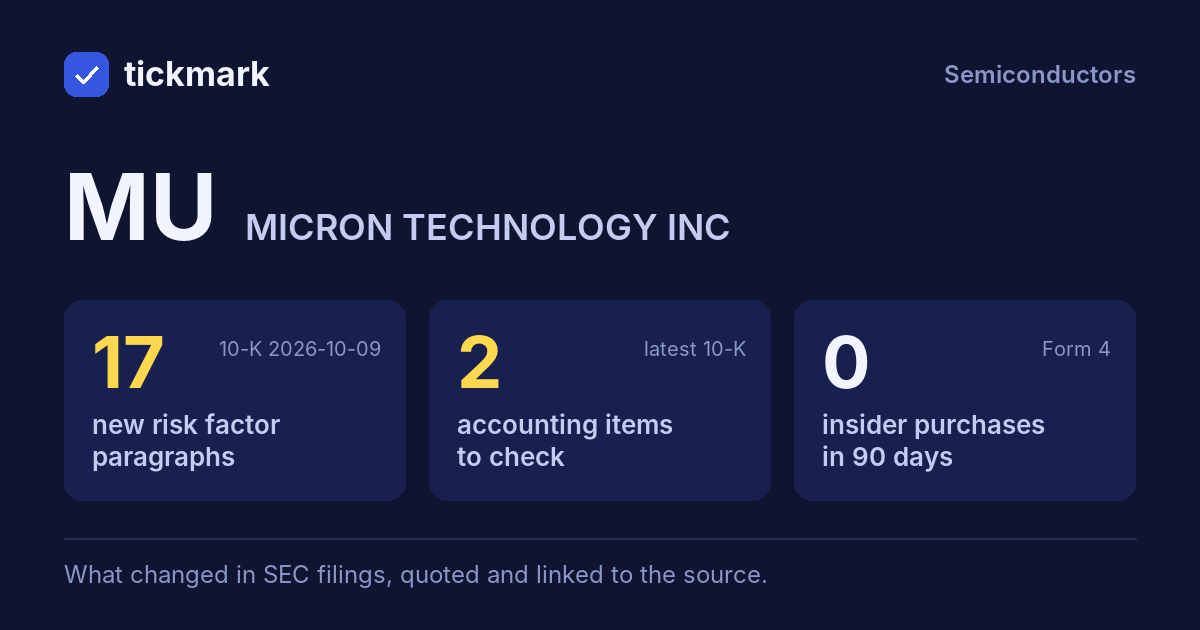
17 new risk paragraphs and 2 accounting facts worth reading about. 10-K filed Oct 9, 2026 against Oct 3, 2025.
Each row opens the detail with the quote and the filing. A row is a change worth reading, not a verdict.
Accounting checks
11 checks on the latest 10-K. Checks, not verdicts.
2facts worth reading about the other 9 checks found nothing to note
-
Receivables growing faster than revenueReceivables +343.9% vs revenue +256.3% (+87.5 pts)
-
Critical audit matters changedNew this year: Revenue Recognition (“As described in Note 1 to the consolidated financial statements, revenue is primarily recognized at a point in time when control of the promised goods is transferred to customers at an amount that reflects the consideration the Company expects to be entitled to in exchange for those goods. Contracts”). No longer listed: Accounting for the U.S. CHIPS Act Funding Agreements
-
Cash from operations $89.7B vs net income $85.0B (FY ending Sep 3, 2026)
8 more checks with nothing to note
-
Inventory +24.1% vs revenue +256.3% (-232.2 pts)
-
Same auditor in both 10-Ks: PricewaterhouseCoopers LLP
-
No statement of substantial doubt about going concern
-
No 8-K item 4.02 in the last 2 years
-
No NT 10-K or NT 10-Q in the last 2 years
-
No sentence in the 10-K concludes that controls were not effective because of a material weakness
-
No 8-K item 2.06 in the last 2 years
-
No 8-K item 1.03 in the last 2 years
In their words
17 paragraphs in Risk Factors that were not in the 10-K filed Oct 3, 2025. Quoted as filed.
-
Item 1A · new paragraph · not in the 10-K filed Oct 3, 2025 10-K, ITEM 1A
In 2026, over half of our total revenue came from our top ten customers. Among our end markets, approximately 60% of our total revenue was concentrated in the data center end market. A disruption in our relationship with any of our top customers or a significant decrease in demand for our data center products, including due to…
-
Item 1A · new paragraph · not in the 10-K filed Oct 3, 2025 10-K, ITEM 1A
We could experience fluctuations in our customer base or the mix of revenue by customer or end market, as markets and strategies evolve. Demand for our products may fluctuate due to factors beyond our control. Our inability to qualify our products to meet customer or end market requirements could adversely impact our revenue. A…
-
Item 1A · new paragraph · not in the 10-K filed Oct 3, 2025 10-K, ITEM 1A
Additionally, AI algorithms or training methodologies may be flawed, and datasets may contain irrelevant, insufficient, or biased information, which can cause errors in outputs. Failures to develop, deploy, or use AI technologies in a safe, responsible, and effective manner, whether by us, our customers, suppliers, partners, or…
-
Item 1A · new paragraph · not in the 10-K filed Oct 3, 2025 10-K, ITEM 1A
We rely on a large, skilled workforce to operate our semiconductor manufacturing facilities worldwide. A substantial portion of our global production capacity is concentrated in several of our manufacturing facilities, and our wafer fabrication output depends on their continued, uninterrupted operation. Certain of our employees have…
New risk paragraphs, against peers
Latest 10-K of each, Technology companies closest in revenue
Paragraphs in Risk Factors with nothing like them in the company's 10-K the year before. A count of text, not of risk.
Financial performance
Last 4 fiscal years · 10-K XBRL
| Metric | FY2023 | FY2024 | FY2025 | FY2026 |
|---|---|---|---|---|
| Revenue | $15.5B | $25.1B | $37.4B | $133.2B |
| Net income | −$5.8B | $778.0M | $8.5B | $85.0B |
| Operating cash flow | $1.6B | $8.5B | $17.5B | $89.7B |
| Free cash flow | −$6.1B | $121.0M | $1.7B | $59.0B |
Revenue, FY2017 to FY2026
Ten fiscal years, each from its own 10-K · XBRL · USD
$133.2B ▲ 256.3% in FY2026$85.0B ▲ 895.1% in FY2026$59.0B ▲ 3435.0% in FY2026
Recent filings
1 filing in the last 30 days · SEC EDGAR
-
8-KNov 5, 2026Director or officer change 8-K item 5.02
About the company
Micron Technology, Boise, ID · from the 10-K filed Oct 9, 2026
We are a global leader in semiconductor memory and storage, powering AI and compute-intensive applications from cloud to edge. With a relentless focus on our customers, technology and product leadership, and manufacturing and operational excellence, our comprehensive portfolio of high-performance DRAM, NAND, and NOR solutions deliver the speed, efficiency, and scale today’s workloads demand, accelerating intelligence to enrich life for all.
- Headquarters
- Boise, ID
- Country
- United States
- Reports in
- USD
- Listed on
- Nasdaq
- Fiscal year ends
- September 2
- Last results
- Sep 30, 2026
- Incorporated in
- DE
Employees, at the top of the page: "As of September 3, 2026, we had approximately 61,000 employees located primarily in Asia, North America, and Europe" (10-K). Address and exchange: SEC's company file.
Email alerts
Sources
The 10-K filed Oct 9, 2026 (open at SEC), compared with the 10-K filed Oct 3, 2025. Numbers from the XBRL of the 10-Ks; filings from SEC EDGAR.
Work with it: Excel workbook · CSV. Google Sheet that stays up to date: paste =IMPORTDATA("https://tickdelta.com/company/MU/export.csv") into a cell.