Nvidia NVDA
NVIDIA pioneered accelerated computing to help solve the most challenging computational problems. 10-K, Item 1
- Employees
- 42,000
- Headquarters
- Santa Clara, CA
- CEO
- Jen Hsun Huang
- Next results
- around Nov 18, 2026
Where each dollar of revenue went, FY2026
Revenue of $215.9B through the costs to a net profit of $120.1B · income statement of the 10-K
NVDA among Technology peers
Six ratios from the latest 10-K. Each corner is the share of 74 peers the company is above, not a score.
What changed
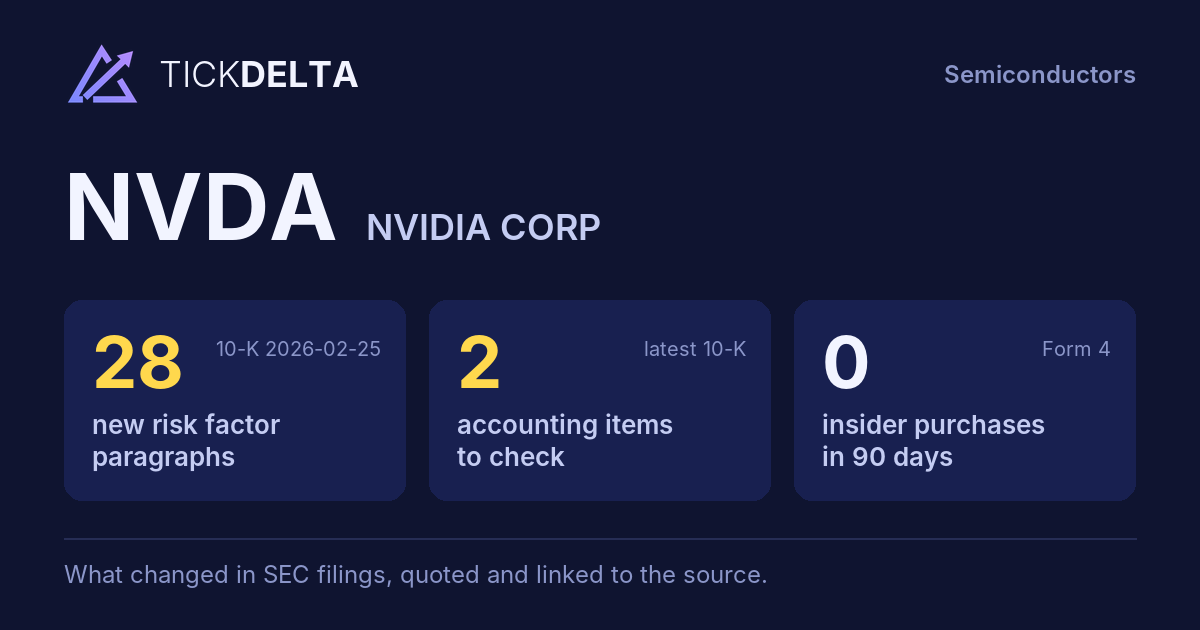
28 new risk paragraphs and 2 accounting facts worth reading about. 10-K filed Feb 25, 2026 against Feb 26, 2025.
Each row opens the detail with the quote and the filing. A row is a change worth reading, not a verdict.
Accounting checks
11 checks on the latest 10-K. Checks, not verdicts.
2facts worth reading about the other 9 checks found nothing to note
-
Cash from operations lower than net incomeCash from operations $102.7B vs net income $120.1B (FY ending Jan 25, 2026)
-
Inventory growing faster than revenueInventory +112.3% vs revenue +65.5% (+46.9 pts)
-
Receivables +66.8% vs revenue +65.5% (+1.3 pts)
8 more checks with nothing to note
-
Same auditor in both 10-Ks: PricewaterhouseCoopers LLP
-
No statement of substantial doubt about going concern
-
No 8-K item 4.02 in the last 2 years
-
No NT 10-K or NT 10-Q in the last 2 years
-
The same matters as last year: Valuation of Inventories - Provisions for Excess or Obsolete Inventories and Excess Product Purchase Commitments
-
No sentence in the 10-K concludes that controls were not effective because of a material weakness
-
No 8-K item 2.06 in the last 2 years
-
No 8-K item 1.03 in the last 2 years
In their words
28 paragraphs in Risk Factors that were not in the 10-K filed Feb 26, 2025. Quoted as filed.
-
Item 1A · new paragraph · not in the 10-K filed Feb 26, 2025 10-K, ITEM 1A
We have entered into an intellectual property license arrangement with Groq, Inc., or Groq, that required significant, nonrefundable payments. Successfully incorporating the licensed technology into our architectures and product roadmaps requires significant engineering effort and may not occur on expected timelines or at all. The…
-
Item 1A · new paragraph · not in the 10-K filed Feb 26, 2025 10-K, ITEM 1A
We are increasing our U.S.-based manufacturing and investing in specialized equipment and processes to support domestic production. We may experience delays or difficulties in scaling production as planned. Our ability to increase manufacturing capabilities will depend on the domestic manufacturing ecosystem's capacity to ramp…
-
Item 1A · new paragraph · not in the 10-K filed Feb 26, 2025 10-K, ITEM 1A
Individuals, groups of hackers and sophisticated organizations, including nation-states and nation-state-supported actors, and other threat actors have engaged and are expected to continue to engage in cyber-attacks. Additionally, some actors are using AI technology to launch more automated, targeted and coordinated attacks. Due to…
-
Item 1A · new paragraph · not in the 10-K filed Feb 26, 2025 10-K, ITEM 1A
Factors that have caused and/or could in the future cause disruptions to our worldwide operations include: natural disasters, extreme weather conditions, power or water shortages, critical infrastructure failures, telecommunications failures, supplier disruptions, terrorist attacks, acts of violence, political and/or civil unrest, acts…
New risk paragraphs, against peers
Latest 10-K of each, Technology companies closest in revenue
Paragraphs in Risk Factors with nothing like them in the company's 10-K the year before. A count of text, not of risk.
From the same starting line, FY2017 to FY2026
Revenue, net income and free cash flow, each set to 100 in FY2017. What happened, from the 10-Ks. Not a forecast.
Financial performance
Last 4 fiscal years · 10-K XBRL
| Metric | FY2023 | FY2024 | FY2025 | FY2026 |
|---|---|---|---|---|
| Revenue | $27.0B | $60.9B | $130.5B | $215.9B |
| Net income | $4.4B | $29.8B | $72.9B | $120.1B |
| Operating cash flow | $5.6B | $28.1B | $64.1B | $102.7B |
| Free cash flow | $3.8B | $27.0B | $60.9B | $96.7B |
Revenue, FY2017 to FY2026
Ten fiscal years, each from its own 10-K · XBRL · USD
$215.9B ▲ 65.5% in FY2026$120.1B ▲ 64.7% in FY2026$96.7B ▲ 58.9% in FY2026
Recent filings
No new filings in the last 30 days · SEC EDGAR
Nothing new. The most recent filings:
-
8-KSep 3, 2026Other events 8-K item 8.01
-
8-KAug 26, 2026Quarterly results 8-K item 2.02
-
10-QAug 26, 2026Quarterly report (10-Q) period ended Jul 26, 2026
-
8-KAug 17, 2026Material agreement signed, New debt or obligation, Regulation FD disclosure 8-K items 1.01, 2.03, 7.01
About the company
Nvidia, Santa Clara, CA · from the 10-K filed Feb 25, 2026
NVIDIA pioneered accelerated computing to help solve the most challenging computational problems. NVIDIA is now a data center scale AI infrastructure company reshaping all industries. Our technology stack includes the foundational NVIDIA CUDA development platform that runs on all NVIDIA GPUs, as well as hundreds of domain-specific software libraries, frameworks, algorithms, software development kits, or SDKs, and application programming interfaces, or APIs.
- Headquarters
- Santa Clara, CA
- Country
- United States
- Reports in
- USD
- Listed on
- Nasdaq
- Fiscal year ends
- January 31
- Last results
- Aug 26, 2026
- Incorporated in
- DE
Employees, at the top of the page: "As of the end of fiscal year 2026, we had approximately 42,000 employees in 38 countries; 31,000 were engaged in research and development and 11,000 were engaged in sales, marketing, operations, and administrative positions" (10-K). Address and exchange: SEC's company file.
Email alerts
Sources
The 10-K filed Feb 25, 2026 (open at SEC), compared with the 10-K filed Feb 26, 2025. Numbers from the XBRL of the 10-Ks; filings from SEC EDGAR.
Work with it: Excel workbook · CSV. Google Sheet that stays up to date: paste =IMPORTDATA("https://tickdelta.com/company/NVDA/export.csv") into a cell.