NXP Semiconductors NXPI
NXP Semiconductors N.V. is a global semiconductor company and a long-standing supplier in the industry, with over 70 years of innovation and operating history. 10-K, Item 1
- Employees
- 32,169
- CEO
- Rafael Sotomayor
- Next results
- around Feb 2, 2027
Where each dollar of revenue went, FY2025
Revenue of $12.3B through the costs to a net profit of $2.0B · income statement of the 10-K
NXPI among Technology peers
Six ratios from the latest 10-K. Each corner is the share of 74 peers the company is above, not a score.
What changed
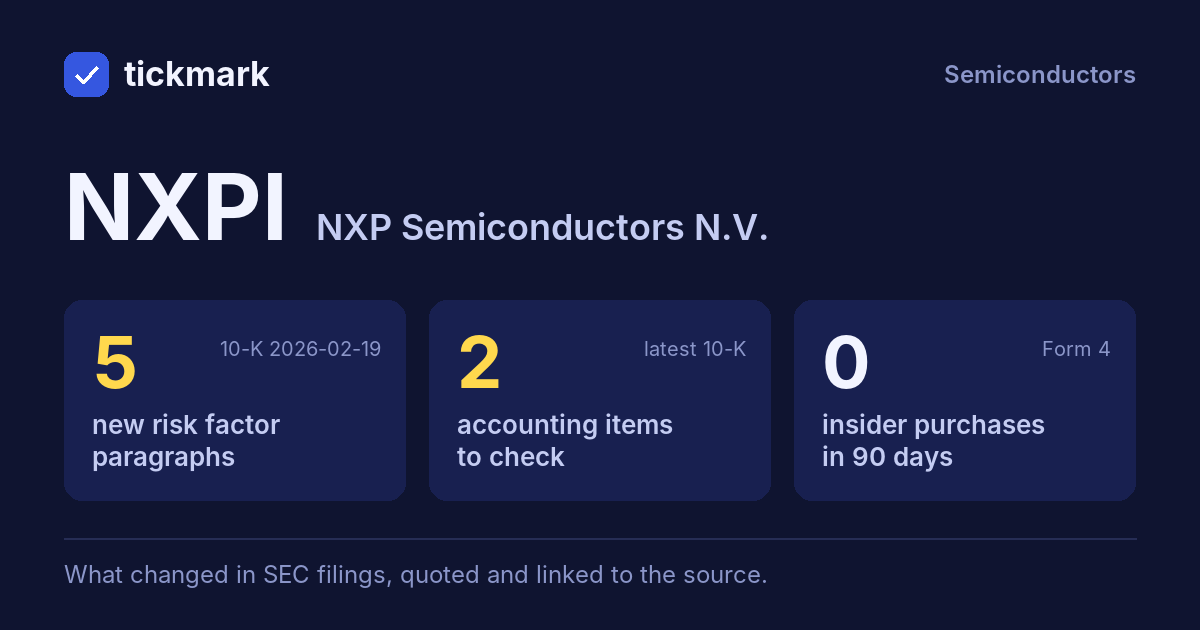
5 new risk paragraphs and 2 accounting facts worth reading about. 10-K filed Feb 19, 2026 against Feb 20, 2025.
Each row opens the detail with the quote and the filing. A row is a change worth reading, not a verdict.
Accounting checks
11 checks on the latest 10-K. Checks, not verdicts.
2facts worth reading about the other 9 checks found nothing to note
-
Inventory growing faster than revenueInventory +9.4% vs revenue -2.7% (+12.1 pts)
-
Critical audit matters changedNew this year: Valuation of certain intangible assets acquired in business combinations (“As described in Notes 2 and 3 to the consolidated financial statements, during 2025, the Company completed the acquisitions of TTTech Auto, Aviva Links and Kinara, Inc., for net considerations of $766 million, $248 million and $284 million, respectively. The fair value of identified intangible asset”). Same as last year: Revenue recognition – Variable consideration under the distributor incentive programs
-
Receivables +2.2% vs revenue -2.7% (+5.0 pts)
8 more checks with nothing to note
-
Cash from operations $2.8B vs net income $2.0B (FY ending Dec 31, 2025)
-
Same auditor in both 10-Ks: EY Accountants B.V.
-
No statement of substantial doubt about going concern
-
No 8-K item 4.02 in the last 2 years
-
No NT 10-K or NT 10-Q in the last 2 years
-
No sentence in the 10-K concludes that controls were not effective because of a material weakness
-
No 8-K item 2.06 in the last 2 years
-
No 8-K item 1.03 in the last 2 years
In their words
5 paragraphs in Risk Factors that were not in the 10-K filed Feb 20, 2025. Quoted as filed.
-
Item 1A · new paragraph · not in the 10-K filed Feb 20, 2025 10-K, ITEM 1A
Recently announced and future tariffs and other trade restrictions could materially and adversely affect our business, financial condition and results of operations. In 2025, the U.S. government announced a series of tariffs, including tariffs targeting a broad range of imports and targeted tariffs on goods from specific countries and…
-
Item 1A · new paragraph · not in the 10-K filed Feb 20, 2025 10-K, ITEM 1A
Additionally, our acquisitions and other strategic investments may require approval by government agencies in applicable jurisdictions in which we operate. Certain agencies in the past have, and may in the future, deny the transaction or fail to approve in a timely manner, resulting in delays in closing and us not realizing the…
-
Item 1A · new paragraph · not in the 10-K filed Feb 20, 2025 10-K, ITEM 1A
Effective October 28, 2025, Kurt Sievers voluntarily retired as our CEO and executive director and Rafael Sotomayor succeeded Mr. Sievers as President and CEO and temporary executive director of the Company. Any significant leadership change involves inherent risk, including potential disruptions to our operations or relationships with…
New risk paragraphs, against peers
Latest 10-K of each, Technology companies closest in revenue
Paragraphs in Risk Factors with nothing like them in the company's 10-K the year before. A count of text, not of risk.
From the same starting line, FY2016 to FY2025
Revenue, net income and free cash flow, each set to 100 in FY2016. What happened, from the 10-Ks. Not a forecast.
Financial performance
Last 4 fiscal years · 10-K XBRL
| Metric | FY2022 | FY2023 | FY2024 | FY2025 |
|---|---|---|---|---|
| Revenue | $13.2B | $13.3B | $12.6B | $12.3B |
| Net income | $2.8B | $2.8B | $2.5B | $2.0B |
| Operating cash flow | $3.9B | $3.5B | $2.8B | $2.8B |
| Free cash flow | $2.8B | $2.7B | $2.1B | $2.4B |
Revenue, FY2016 to FY2025
Ten fiscal years, each from its own 10-K · XBRL · USD
$12.3B ▼ 2.7% in FY2025$2.0B ▼ 19.5% in FY2025$2.4B ▲ 17.9% in FY2025
Recent filings
2 filings in the last 30 days · SEC EDGAR
-
8-KOct 27, 2026Quarterly results 8-K item 2.02
-
10-QOct 27, 2026Quarterly report (10-Q) period ended Sep 27, 2026
About the company
NXP Semiconductors · from the 10-K filed Feb 19, 2026
NXP Semiconductors N.V. is a global semiconductor company and a long-standing supplier in the industry, with over 70 years of innovation and operating history. For the year ended December 31, 2025, we generated revenue of $12,269 million, compared to $12,614 million for the year ended December 31, 2024. We provide leading solutions that leverage our combined portfolio of intellectual property, deep application knowledge, process technology and manufacturing expertise in the domains of embedded processing, mixed-signal analog-digital (mixed A/D), power management, digital signal processing, cryptography-security, high-speed interface, radio frequency (RF), and embedded system design.
- Reports in
- USD
- Listed on
- Nasdaq
- Fiscal year ends
- December 31
- Last results
- Oct 27, 2026
Employees, at the top of the page: "As of December 31, 2025, we employed approximately 32,169 employees worldwide, including approximately 1,439 employees within our SSMC joint venture" (10-K). Address and exchange: SEC's company file.
Email alerts
Sources
The 10-K filed Feb 19, 2026 (open at SEC), compared with the 10-K filed Feb 20, 2025. Numbers from the XBRL of the 10-Ks; filings from SEC EDGAR.
Work with it: Excel workbook · CSV. Google Sheet that stays up to date: paste =IMPORTDATA("https://tickdelta.com/company/NXPI/export.csv") into a cell.