OLIN Corp OLN
- Employees
- 7,849
- Headquarters
- Clayton, MO
- Next results
- around Jan 7, 2027
Where each dollar of revenue went, FY2024
Revenue of $6.5B through the costs to a net profit of $105.0M · income statement of the 10-K
OLN among Materials peers
Six ratios from the latest 10-K. Each corner is the share of 84 peers the company is above, not a score.
What changed
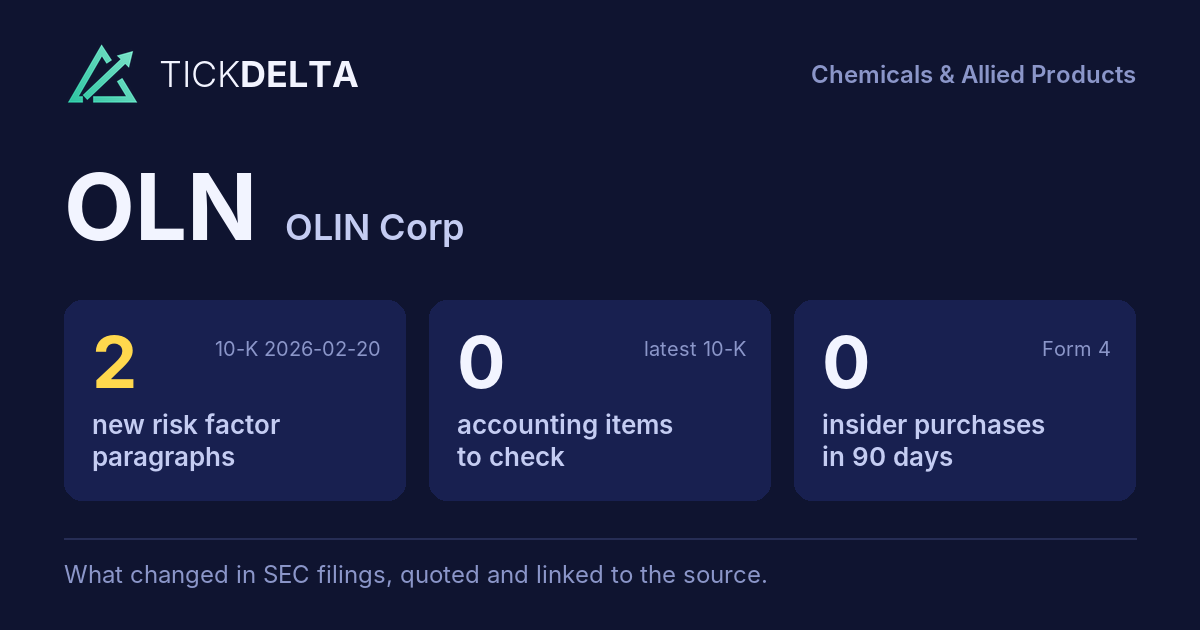
2 new risk paragraphs. 10-K filed Feb 20, 2026 against Feb 20, 2025.
Each row opens the detail with the quote and the filing. A row is a change worth reading, not a verdict.
Accounting checks
10 checks on the latest 10-K. Checks, not verdicts.
0facts worth reading about all 10 checks found nothing to note
-
Cash from operations $474.2M vs net income −$101.1M (FY ending Dec 31, 2025)
-
Inventory -4.7% ($823.5M to $784.5M) vs revenue +3.7% ($6.5B to $6.8B), -8.4 pts apart
-
Same auditor in both 10-Ks: KPMG LLP
7 more checks with nothing to note
-
No statement of substantial doubt about going concern
-
No 8-K item 4.02 in the last 2 years
-
No NT 10-K or NT 10-Q in the last 2 years
-
The same matters as last year: Evaluation of Environmental Obligations
-
No sentence in the 10-K concludes that controls were not effective because of a material weakness
-
No 8-K item 2.06 in the last 2 years
-
No 8-K item 1.03 in the last 2 years
In their words
2 paragraphs in Risk Factors that were not in the 10-K filed Feb 20, 2025. Quoted as filed.
-
Item 1A · new paragraph · not in the 10-K filed Feb 20, 2025 10-K, ITEM 1A
•tariffs and trade barriers, including any retaliatory trade policies in response thereto, and the associated impact on trade flows and supply/demand fundamentals;
-
Item 1A · new paragraph · not in the 10-K filed Feb 20, 2025 10-K, ITEM 1A
•adversely affecting our credit ratings which could increase our future costs of funding, liquidity and access to capital markets;
New risk paragraphs, against peers
Latest 10-K of each, Materials companies closest in revenue
Paragraphs in Risk Factors with nothing like them in the company's 10-K the year before. A count of text, not of risk.
Financial performance
Last 4 fiscal years · 10-K XBRL
| Metric | FY2022 | FY2023 | FY2024 | FY2025 |
|---|---|---|---|---|
| Revenue | $9.4B | $6.8B | $6.5B | $6.8B |
| Net income | $1.3B | $452.0M | $105.0M | −$101.1M |
| Operating cash flow | $1.9B | $974.3M | $503.2M | $474.2M |
| Free cash flow | $1.7B | $738.3M | $308.1M | $247.9M |
Revenue, FY2016 to FY2025
Ten fiscal years, each from its own 10-K · XBRL · USD
$6.8B ▲ 3.7% in FY2025−$101.1M in FY2025$247.9M ▼ 19.5% in FY2025
Recent filings
4 filings in the last 30 days · SEC EDGAR
-
8-KNov 4, 2026Material agreement signed 8-K item 1.01
-
10-QOct 30, 2026Quarterly report (10-Q) period ended Sep 30, 2026
-
8-KOct 29, 2026Quarterly results 8-K item 2.02
-
8-KOct 28, 2026Material agreement signed, New debt or obligation 8-K items 1.01, 2.03
About the company
OLIN Corp, Clayton, MO · from the 10-K filed Feb 20, 2026
Olin Corporation (Olin, the Company, we or our) is a Virginia corporation, incorporated in 1892, having its principal executive offices in Clayton, MO. We are a leading vertically integrated global manufacturer and distributor of chemical products and a leading U.S. manufacturer of ammunition. Our operations are concentrated in three business segments: Chlor Alkali Products and Vinyls, Epoxy and Winchester. All of our business segments are capital-intensive manufacturing businesses.
- Headquarters
- Clayton, MO
- Country
- United States
- Reports in
- USD
- Listed on
- NYSE
- Fiscal year ends
- December 31
- Last results
- Oct 29, 2026
- Incorporated in
- VA
Employees, at the top of the page: "As of December 31, 2025, we had 7,849 employees broken out as follows: Country or Region Number of Employees Percent of Total ──────────────────────────────────────────────────────────────────────────────────────────────────────── United States(1) 6,760 86% Foreign: Europe, the Middle East, Africa, " (10-K). Address and exchange: SEC's company file.
Email alerts
Sources
The 10-K filed Feb 20, 2026 (open at SEC), compared with the 10-K filed Feb 20, 2025. Numbers from the XBRL of the 10-Ks; filings from SEC EDGAR.
Work with it: Excel workbook · CSV. Google Sheet that stays up to date: paste =IMPORTDATA("https://tickdelta.com/company/OLN/export.csv") into a cell.