ON Semiconductor ON
ON Semiconductor Corporation, together with its wholly and majority-owned subsidiaries, which operate under the onsemiTM brand ("onsemi," "we," "us," "our," or the "Company"), was incorporated under the laws of the State of Delaware in 1992. 10-K, Item 1
- Headquarters
- Scottsdale, AZ
- Next results
- around Feb 8, 2027
Where each dollar of revenue went, FY2025
Revenue of $6.0B through the costs to a net profit of $121.0M · income statement of the 10-K
ON among Technology peers
Six ratios from the latest 10-K. Each corner is the share of 74 peers the company is above, not a score.
What changed
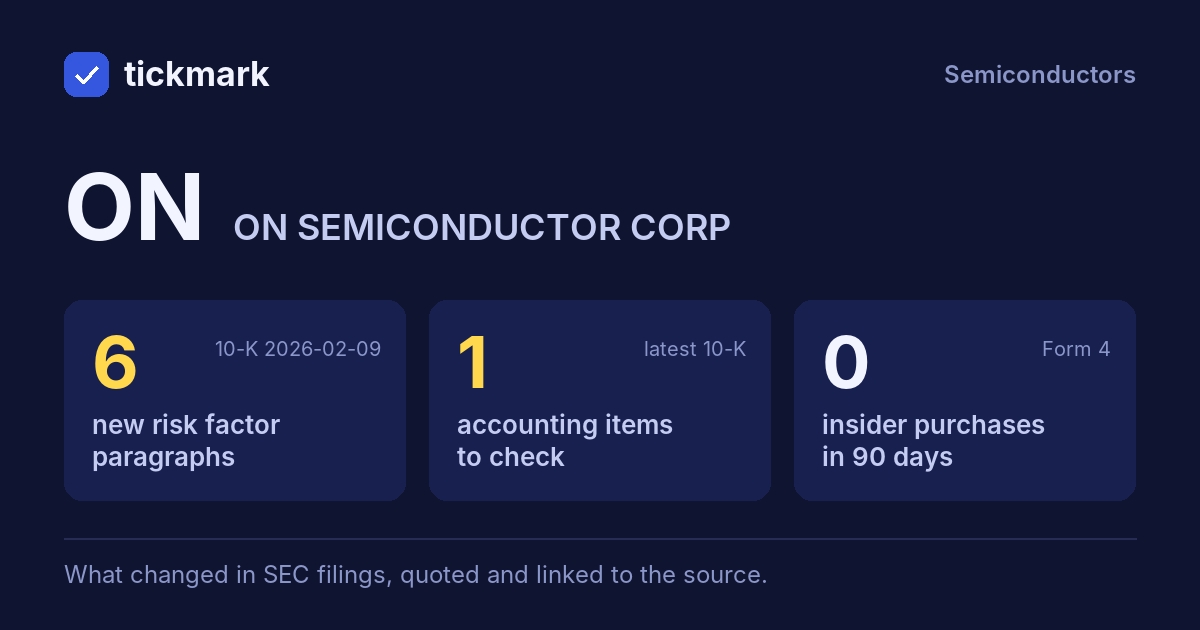
6 new risk paragraphs and 1 accounting fact worth reading about. 10-K filed Feb 9, 2026 against Feb 10, 2025.
Each row opens the detail with the quote and the filing. A row is a change worth reading, not a verdict.
Accounting checks
11 checks on the latest 10-K. Checks, not verdicts.
1fact worth reading about the other 10 checks found nothing to note
-
Material impairment (8-K item 2.06)8-K item 2.06 (material impairments) filed Nov 17, 2025 (2 in 2 years): “During the first quarter of 2025, ON Semiconductor Corporation (the “Company” or “we” and, together with its subsidiaries, “onsemi”) announced restructuring and cost reduction initiatives based on an evaluation of its operating structure, business strategy, manufacturing technologies and internal capabilities to realign internal manufacturing capacity and capabilities with anticipated long-term…”
-
Receivables -21.7% vs revenue -15.3% (-6.4 pts)
9 more checks with nothing to note
-
Cash from operations $1.8B vs net income $121.0M (FY ending Dec 31, 2025)
-
Inventory -11.3% vs revenue -15.3% (+4.1 pts)
-
Same auditor in both 10-Ks: PricewaterhouseCoopers LLP
-
No statement of substantial doubt about going concern
-
No 8-K item 4.02 in the last 2 years
-
No NT 10-K or NT 10-Q in the last 2 years
-
The same matters as last year: Valuation of Inventories
-
No sentence in the 10-K concludes that controls were not effective because of a material weakness
-
No 8-K item 1.03 in the last 2 years
In their words
6 paragraphs in Risk Factors that were not in the 10-K filed Feb 10, 2025. Quoted as filed.
-
Item 1A · new paragraph · not in the 10-K filed Feb 10, 2025 10-K, ITEM 1A
We had one customer, a distributor, whose revenue accounted for approximately 11% and 10% of the total revenue for the years ended 2025 and 2024, respectively, across all reportable segments. Although we are not dependent on any single customer, a significant disruption in key customer relationships could adversely affect our business.…
-
Item 1A · new paragraph · not in the 10-K filed Feb 10, 2025 10-K, ITEM 1A
We are increasingly incorporating AI tools and capabilities into our business operations where we believe appropriate, which may subject us to significant competitive, legal, regulatory and other risks. There can be no assurance that our use of AI tools will enhance our business operations or result in a benefit to us. Our competitors…
-
Item 1A · new paragraph · not in the 10-K filed Feb 10, 2025 10-K, ITEM 1A
On July 4, 2025, the U.S. government enacted the One Big Beautiful Bill Act (the “OBBBA”). While we are subject to the Corporate Alternative Minimum Tax (“CAMT”), we currently have no CAMT liability. However, future changes in our financial results, business operations, or the interpretation and implementation of the OBBBA could result…
New risk paragraphs, against peers
Latest 10-K of each, Technology companies closest in revenue
Paragraphs in Risk Factors with nothing like them in the company's 10-K the year before. A count of text, not of risk.
From the same starting line, FY2016 to FY2025
Revenue, net income and free cash flow, each set to 100 in FY2016. What happened, from the 10-Ks. Not a forecast.
Financial performance
Last 4 fiscal years · 10-K XBRL
| Metric | FY2022 | FY2023 | FY2024 | FY2025 |
|---|---|---|---|---|
| Revenue | $8.3B | $8.3B | $7.1B | $6.0B |
| Net income | $1.9B | $2.2B | $1.6B | $121.0M |
| Operating cash flow | $2.6B | $2.0B | $1.9B | $1.8B |
| Free cash flow | $1.6B | $438.4M | $1.2B | $1.4B |
Revenue, FY2016 to FY2025
Ten fiscal years, each from its own 10-K · XBRL · USD
$6.0B ▼ 15.3% in FY2025$121.0M ▼ 92.3% in FY2025$1.4B ▲ 17.0% in FY2025
Recent filings
3 filings in the last 30 days · SEC EDGAR
-
8-KNov 2, 2026Material agreement signed, Regulation FD disclosure 8-K items 1.01, 7.01
-
8-KNov 2, 2026Quarterly results 8-K item 2.02
-
10-QNov 2, 2026Quarterly report (10-Q) period ended Oct 2, 2026
About the company
ON Semiconductor, Scottsdale, AZ · from the 10-K filed Feb 9, 2026
ON Semiconductor Corporation, together with its wholly and majority-owned subsidiaries, which operate under the onsemiTM brand ("onsemi," "we," "us," "our," or the "Company"), was incorporated under the laws of the State of Delaware in 1992. We offer intelligent power and intelligent sensing solutions that drive electrification, energy efficiency, safety, and automation in automotive, industrial, and other end-markets, including AI data center. Our intelligent power technologies enable the electrification of drivetrain in the automotive industry to allow for lighter and longer-range electric vehicles and empower efficient fast-charging systems.
- Headquarters
- Scottsdale, AZ
- Country
- United States
- Reports in
- USD
- Listed on
- Nasdaq
- Fiscal year ends
- December 31
- Last results
- Nov 2, 2026
- Incorporated in
- DE
Email alerts
Sources
The 10-K filed Feb 9, 2026 (open at SEC), compared with the 10-K filed Feb 10, 2025. Numbers from the XBRL of the 10-Ks; filings from SEC EDGAR.
Work with it: Excel workbook · CSV. Google Sheet that stays up to date: paste =IMPORTDATA("https://tickdelta.com/company/ON/export.csv") into a cell.