Qualcomm QCOM
We incorporated in California in 1985 and reincorporated in Delaware in 1991. 10-K, Item 1
- Headquarters
- San Diego, CA
- CEO
- Cristiano R. Amon
- Next results
- around Feb 3, 2027
Where each dollar of revenue went, FY2026
Revenue of $43.1B through the costs to a net profit of $13.6B · income statement of the 10-K
QCOM among Technology peers
Six ratios from the latest 10-K. Each corner is the share of 74 peers the company is above, not a score.
What changed
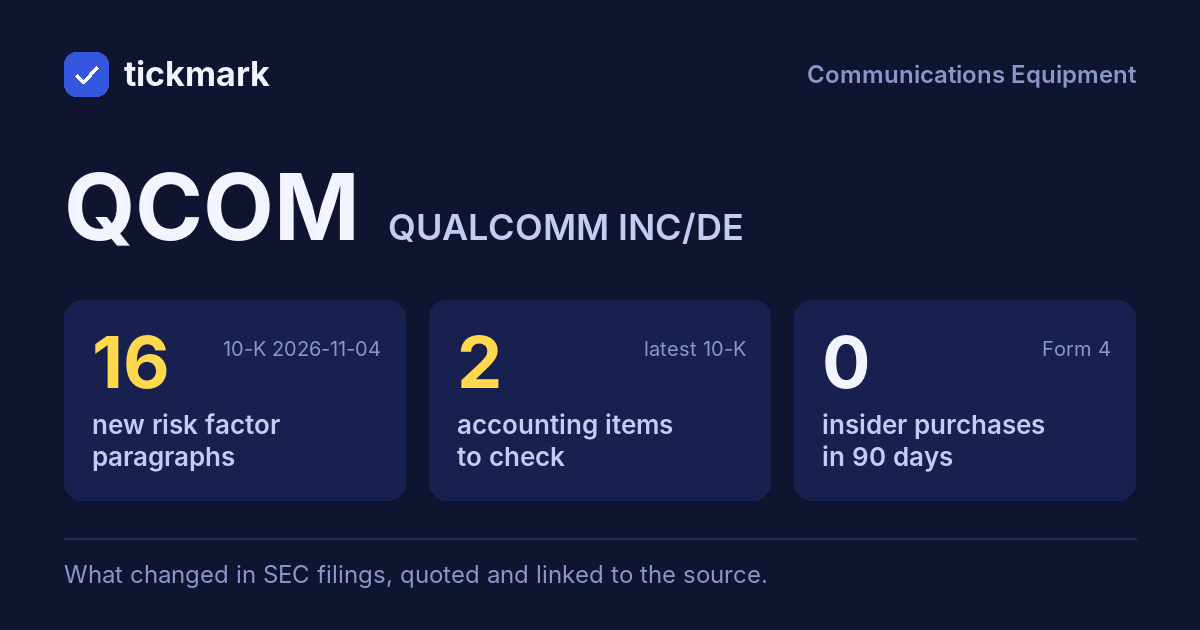
16 new risk paragraphs and 2 accounting facts worth reading about. 10-K filed Nov 4, 2026 against Nov 5, 2025.
Each row opens the detail with the quote and the filing. A row is a change worth reading, not a verdict.
Accounting checks
11 checks on the latest 10-K. Checks, not verdicts.
2facts worth reading about the other 9 checks found nothing to note
-
Cash from operations lower than net incomeCash from operations $11.1B vs net income $13.6B (FY ending Sep 27, 2026)
-
Inventory growing faster than revenueInventory +32.4% vs revenue -2.6% (+35.0 pts)
-
Receivables -6.4% vs revenue -2.6% (-3.8 pts)
8 more checks with nothing to note
-
Same auditor in both 10-Ks: PricewaterhouseCoopers LLP
-
No statement of substantial doubt about going concern
-
No 8-K item 4.02 in the last 2 years
-
No NT 10-K or NT 10-Q in the last 2 years
-
The same matters as last year: F-1; Revenue Recognition - Qualcomm CDMA Technologies (QCT) Segment
-
No sentence in the 10-K concludes that controls were not effective because of a material weakness
-
No 8-K item 2.06 in the last 2 years
-
No 8-K item 1.03 in the last 2 years
In their words
16 paragraphs in Risk Factors that were not in the 10-K filed Nov 5, 2025. Quoted as filed.
-
Item 1A · new paragraph · not in the 10-K filed Nov 5, 2025 10-K, ITEM 1A
Although we expect to derive an increasing portion of our revenues from areas outside of mobile handsets, such as automotive, IoT and data center, we continue to derive a significant portion of our revenues from a small number of mobile handset customers and licensees, and particularly from their sale of premium-tier handset devices.…
-
Item 1A · new paragraph · not in the 10-K filed Nov 5, 2025 10-K, ITEM 1A
Further, as we seek to grow and diversify our business in areas such as automotive, IoT and data center, we may also derive a significant portion of revenues in such areas from a limited number of customers, hyperscalers, automakers or other industry participants.
-
Item 1A · new paragraph · not in the 10-K filed Nov 5, 2025 10-K, ITEM 1A
For example, the automotive industry is subject to long design-in time frames, long product life cycles and a high degree of regulatory, safety and other requirements (including, in some cases, customer requirements to meet certain sustainability, climate or other environmental or social-related targets), necessitating suppliers to the…
-
Item 1A · new paragraph · not in the 10-K filed Nov 5, 2025 10-K, ITEM 1A
Our increasing focus on artificial intelligence (AI), including on-device AI, agentic AI and AI infrastructure, may not result in the anticipated benefits and could expose us to additional competitive, regulatory, intellectual property and operational risks. AI technologies, including machine learning, generative AI, agentic AI and…
New risk paragraphs, against peers
Latest 10-K of each, Technology companies closest in revenue
Paragraphs in Risk Factors with nothing like them in the company's 10-K the year before. A count of text, not of risk.
Financial performance
Last 4 fiscal years · 10-K XBRL
| Metric | FY2023 | FY2024 | FY2025 | FY2026 |
|---|---|---|---|---|
| Revenue | $35.8B | $39.0B | $44.3B | $43.1B |
| Net income | $7.2B | $10.1B | $5.5B | $13.6B |
| Operating cash flow | $11.3B | $12.2B | $14.0B | $11.1B |
| Free cash flow | $9.8B | $11.2B | $12.8B | $8.7B |
Revenue, FY2017 to FY2026
Ten fiscal years, each from its own 10-K · XBRL · USD
$43.1B ▼ 2.6% in FY2026$13.6B ▲ 145.9% in FY2026$8.7B ▼ 32.5% in FY2026
Recent filings
2 filings in the last 30 days · SEC EDGAR
-
8-KNov 4, 2026Quarterly results 8-K item 2.02
-
10-KNov 4, 2026Annual report (10-K) period ended Sep 27, 2026
About the company
Qualcomm, San Diego, CA · from the 10-K filed Nov 4, 2026
We incorporated in California in 1985 and reincorporated in Delaware in 1991. We operate and report using a 52-53 week fiscal year ending on the last Sunday in September. Our 52-week fiscal years consist of four equal fiscal quarters of 13 weeks each, and our 53-week fiscal years consist of three 13-week fiscal quarters and one 14-week fiscal quarter. The financial results for our 53-week fiscal years and our 14-week fiscal quarters will not be exactly comparable to our 52-week fiscal years and our 13-week fiscal quarters. Our fiscal years for 2026, 2025 and 2024 included 52 weeks, 52 weeks and 53 weeks, respectively. Our fiscal year for 2027 will include 52 weeks.
- Headquarters
- San Diego, CA
- Country
- United States
- Reports in
- USD
- Listed on
- Nasdaq
- Fiscal year ends
- September 27
- Last results
- Nov 4, 2026
- Incorporated in
- DE
Email alerts
Sources
The 10-K filed Nov 4, 2026 (open at SEC), compared with the 10-K filed Nov 5, 2025. Numbers from the XBRL of the 10-Ks; filings from SEC EDGAR.
Work with it: Excel workbook · CSV. Google Sheet that stays up to date: paste =IMPORTDATA("https://tickdelta.com/company/QCOM/export.csv") into a cell.