Republic Services RSG
Republic Services is one of the largest providers of environmental services in North America, as measured by revenue. 10-K, Item 1
- Headquarters
- Phoenix, AZ
- CEO
- Mr. Vander Ark
- Next results
- around Feb 16, 2027
Where each dollar of revenue went, FY2025
Revenue of $19.0B through the costs to a net profit of $2.1B · income statement of the 10-K
RSG among Industrials peers
Six ratios from the latest 10-K. Each corner is the share of 81 peers the company is above, not a score.
What changed
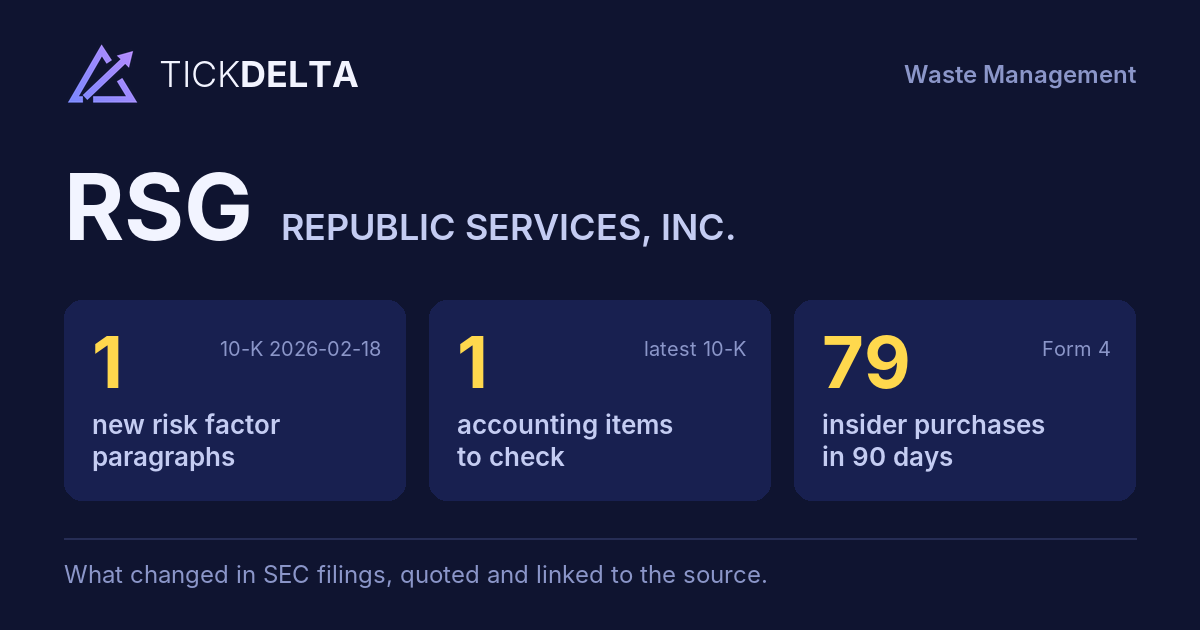
1 new risk paragraph and 1 accounting fact worth reading about. 10-K filed Feb 18, 2026 against Feb 14, 2025.
Each row opens the detail with the quote and the filing. A row is a change worth reading, not a verdict.
Accounting checks
11 checks on the latest 10-K. Checks, not verdicts.
1fact worth reading about the other 10 checks found nothing to note
-
Critical audit matters changedNew this year: T a b l e o f C o n t e n t s (“How We Addressed the Matter in Our Audit We obtained an understanding of, evaluated the design, and tested the operating effectiveness of the Company’s controls over landfill development asset depletion expense. Our audit procedures included, among others, testing controls over the Company’s process”). Same as last year: Landfill Development Asset Depletion; Landfill Final Capping, Closure and Post-Closure Costs
-
Receivables +4.2% vs revenue +3.3% (+0.9 pts)
9 more checks with nothing to note
-
Cash from operations $4.3B vs net income $2.1B (FY ending Dec 31, 2025)
-
Inventory +8.2% vs revenue +3.3% (+4.9 pts)
-
Same auditor in both 10-Ks: Ernst & Young LLP
-
No statement of substantial doubt about going concern
-
No 8-K item 4.02 in the last 2 years
-
No NT 10-K or NT 10-Q in the last 2 years
-
No sentence in the 10-K concludes that controls were not effective because of a material weakness
-
No 8-K item 2.06 in the last 2 years
-
No 8-K item 1.03 in the last 2 years
In their words
1 paragraph in Risk Factors that was not in the 10-K filed Feb 14, 2025. Quoted as filed.
-
Item 1A · new paragraph · not in the 10-K filed Feb 14, 2025 10-K, ITEM 1A
At the U.S. state level, California has taken action to require greenhouse gas emission disclosure, as well as information on climate-related financial risks, some of which are subject to legal challenge. Similar bills have been introduced in other U.S. states; to-date, none have passed into law.
New risk paragraphs, against peers
Latest 10-K of each, Industrials companies closest in revenue
Paragraphs in Risk Factors with nothing like them in the company's 10-K the year before. A count of text, not of risk.
Financial performance
Last 4 fiscal years · 10-K XBRL
| Metric | FY2022 | FY2023 | FY2024 | FY2025 |
|---|---|---|---|---|
| Revenue | $15.6B | $17.3B | $18.4B | $19.0B |
| Net income | $1.5B | $1.7B | $2.0B | $2.1B |
| Operating cash flow | $3.2B | $3.6B | $3.9B | $4.3B |
| Free cash flow | $1.7B | $2.0B | $2.1B | $2.4B |
Revenue, FY2015 to FY2025
Ten fiscal years, each from its own 10-K · XBRL · USD
$19.0B ▲ 3.3% in FY2025$2.1B ▲ 4.7% in FY2025$2.4B ▲ 15.8% in FY2025
Recent filings
2 filings in the last 30 days · SEC EDGAR
-
10-QOct 30, 2026Quarterly report (10-Q) period ended Sep 30, 2026
-
8-KOct 29, 2026Quarterly results, Regulation FD disclosure, Other events 8-K items 2.02, 7.01, 8.01
About the company
Republic Services, Phoenix, AZ · from the 10-K filed Feb 18, 2026
Republic Services is one of the largest providers of environmental services in North America, as measured by revenue. We operate across the United States and Canada through 377 collection operations, 255 transfer stations, 79 recycling centers, 207 active landfills, 2 treatment, recovery and disposal facilities, 24 treatment, storage and disposal facilities (TSDF), 5 salt water disposal wells, 15 deep injection wells, 9 industrial wastewater treatment facilities, and 2 polymer centers. We are engaged in 84 landfill gas-to-energy and other renewable energy projects and had post-closure responsibility for 124 closed landfills.
- Headquarters
- Phoenix, AZ
- Country
- United States
- Reports in
- USD
- Listed on
- NYSE
- Fiscal year ends
- December 31
- Last results
- Oct 29, 2026
- Incorporated in
- DE
Email alerts
Sources
The 10-K filed Feb 18, 2026 (open at SEC), compared with the 10-K filed Feb 14, 2025. Numbers from the XBRL of the 10-Ks; filings from SEC EDGAR.
Work with it: Excel workbook · CSV. Google Sheet that stays up to date: paste =IMPORTDATA("https://tickdelta.com/company/RSG/export.csv") into a cell.