Seagate Technology STX
Seagate is a leading provider of mass-capacity data storage, accelerating the world’s ability to harness the full value of data. 10-K, Item 1
- Employees
- 30,000
- Headquarters
- Singapore, U0
- CEO
- William D. Mosley
- Next results
- around Jan 26, 2027
Where each dollar of revenue went, FY2026
Revenue of $12.2B through the costs to a net profit of $3.2B · income statement of the 10-K
STX among Technology peers
Six ratios from the latest 10-K. Each corner is the share of 74 peers the company is above, not a score.
What changed
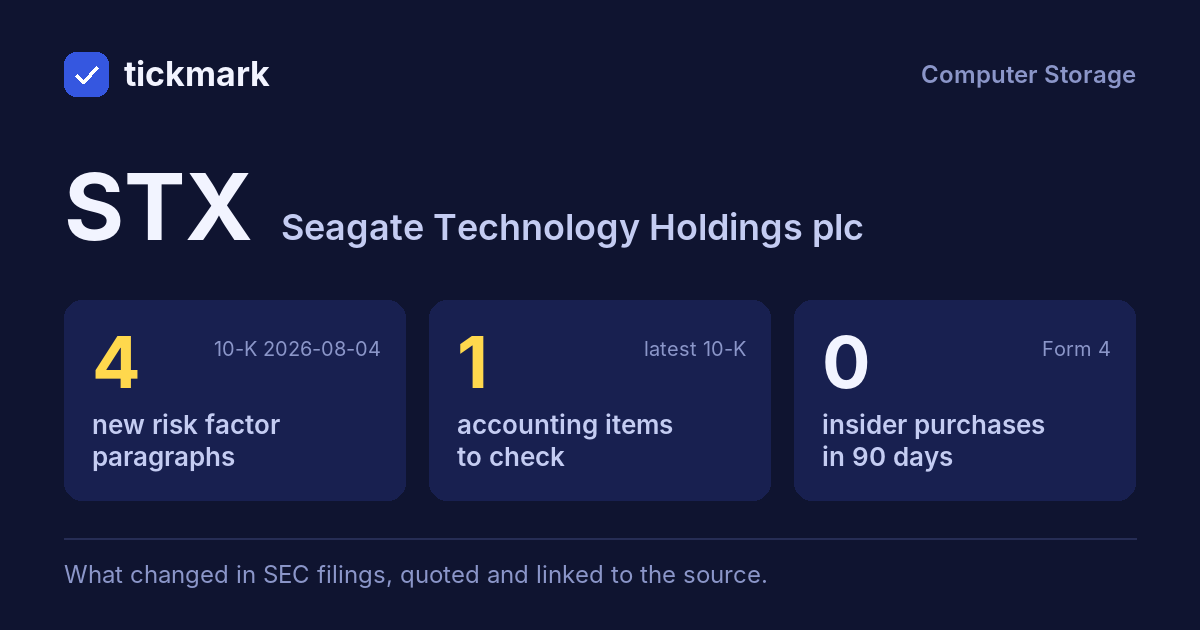
4 new risk paragraphs and 1 accounting fact worth reading about. 10-K filed Aug 4, 2026 against Aug 1, 2025.
Each row opens the detail with the quote and the filing. A row is a change worth reading, not a verdict.
Accounting checks
11 checks on the latest 10-K. Checks, not verdicts.
1fact worth reading about the other 10 checks found nothing to note
-
Receivables growing faster than revenueReceivables +60.0% vs revenue +34.1% (+25.9 pts)
-
Cash from operations $3.7B vs net income $3.2B (FY ending Jul 3, 2026)
9 more checks with nothing to note
-
Inventory +9.1% vs revenue +34.1% (-25.0 pts)
-
Same auditor in both 10-Ks: Ernst & Young LLP
-
No statement of substantial doubt about going concern
-
No 8-K item 4.02 in the last 2 years
-
No NT 10-K or NT 10-Q in the last 2 years
-
No longer listed: Realizability of deferred income taxes. Same as last year: Revenue recognition—Sales incentive program rebates and discounts
-
No sentence in the 10-K concludes that controls were not effective because of a material weakness
-
No 8-K item 2.06 in the last 2 years
-
No 8-K item 1.03 in the last 2 years
In their words
4 paragraphs in Risk Factors that were not in the 10-K filed Aug 1, 2025. Quoted as filed.
-
Item 1A · new paragraph · not in the 10-K filed Aug 1, 2025 10-K, ITEM 1A
We rely extensively on information technology systems, networks, and cloud-based platforms, including those operated by vendors, suppliers, and other third parties, to support our business operations. We and our third party providers are regularly subject to cybersecurity threats and attempted cyberattacks of varying types and degrees…
-
Item 1A · new paragraph · not in the 10-K filed Aug 1, 2025 10-K, ITEM 1A
Armed conflicts and geopolitical tensions may also result in sanctions, export restrictions, tariffs or other trade restrictions, limit or restrict our ability to access certain markets and disrupt key logistics networks, including air and ocean freight travel routes. These developments have increased, and could further increase, costs…
-
Item 1A · new paragraph · not in the 10-K filed Aug 1, 2025 10-K, ITEM 1A
In addition, our operations are conducted at a limited number of facilities, and those of many of our direct and indirect suppliers, manufacturing vendors and customers are similarly concentrated in a limited number of geographic locations. Because our manufacturing footprint, and those of our key suppliers, is concentrated in…
New risk paragraphs, against peers
Latest 10-K of each, Technology companies closest in revenue
Paragraphs in Risk Factors with nothing like them in the company's 10-K the year before. A count of text, not of risk.
From the same starting line, FY2017 to FY2026
Revenue, net income and free cash flow, each set to 100 in FY2017. What happened, from the 10-Ks. Not a forecast.
Financial performance
Last 4 fiscal years · 10-K XBRL
| Metric | FY2023 | FY2024 | FY2027 | FY2026 |
|---|---|---|---|---|
| Revenue | $7.4B | $6.6B | $9.1B | $12.2B |
| Net income | −$529.0M | $335.0M | $1.5B | $3.2B |
| Operating cash flow | $942.0M | $918.0M | $1.1B | $3.7B |
| Free cash flow | $626.0M | $664.0M | $818.0M | $3.1B |
Revenue, FY2017 to FY2026
Ten fiscal years, each from its own 10-K · XBRL · USD
$12.2B ▲ 34.1% in FY2026$3.2B ▲ 116.7% in FY2026$3.1B ▲ 279.6% in FY2026
Recent filings
3 filings in the last 30 days · SEC EDGAR
-
10-QOct 29, 2026Quarterly report (10-Q) period ended Oct 2, 2026
-
8-KOct 28, 2026Shareholder vote results 8-K item 5.07
-
8-KOct 27, 2026Quarterly results, Regulation FD disclosure 8-K items 2.02, 7.01
About the company
Seagate Technology, Singapore, U0 · from the 10-K filed Aug 4, 2026
Seagate is a leading provider of mass-capacity data storage, accelerating the world’s ability to harness the full value of data. For nearly 50 years, our portfolio of advanced storage solutions has helped hyperscale, cloud service providers (“CSPs”), enterprises and consumers protect, create and manage the data that powers their transformation and growth. Hard disk drives (“HDDs”) remain a foundational technology for delivering scalable, energy-efficient, mass-capacity storage with favorable storage economics that underpins modern digital infrastructure.
- Headquarters
- Singapore, U0
- Country
- United States
- Reports in
- USD
- Listed on
- Nasdaq
- Fiscal year ends
- June 27
- Last results
- Oct 27, 2026
Employees, at the top of the page: "As of July 3, 2026, we employed approximately 30,000 full-time employees worldwide, including approximately 25,000 employees located in Asia" (10-K). Address and exchange: SEC's company file.
Email alerts
Sources
The 10-K filed Aug 4, 2026 (open at SEC), compared with the 10-K filed Aug 1, 2025. Numbers from the XBRL of the 10-Ks; filings from SEC EDGAR.
Work with it: Excel workbook · CSV. Google Sheet that stays up to date: paste =IMPORTDATA("https://tickdelta.com/company/STX/export.csv") into a cell.