TransDigm Group TDG
- Headquarters
- Cleveland, OH
- CEO
- Kevin M. Stein
- Next results
- around Feb 2, 2027
Where each dollar of revenue went, FY2026
Revenue of $10.6B through the costs to a net profit of $2.1B · income statement of the 10-K
TDG among Industrials peers
Six ratios from the latest 10-K. Each corner is the share of 81 peers the company is above, not a score.
What changed
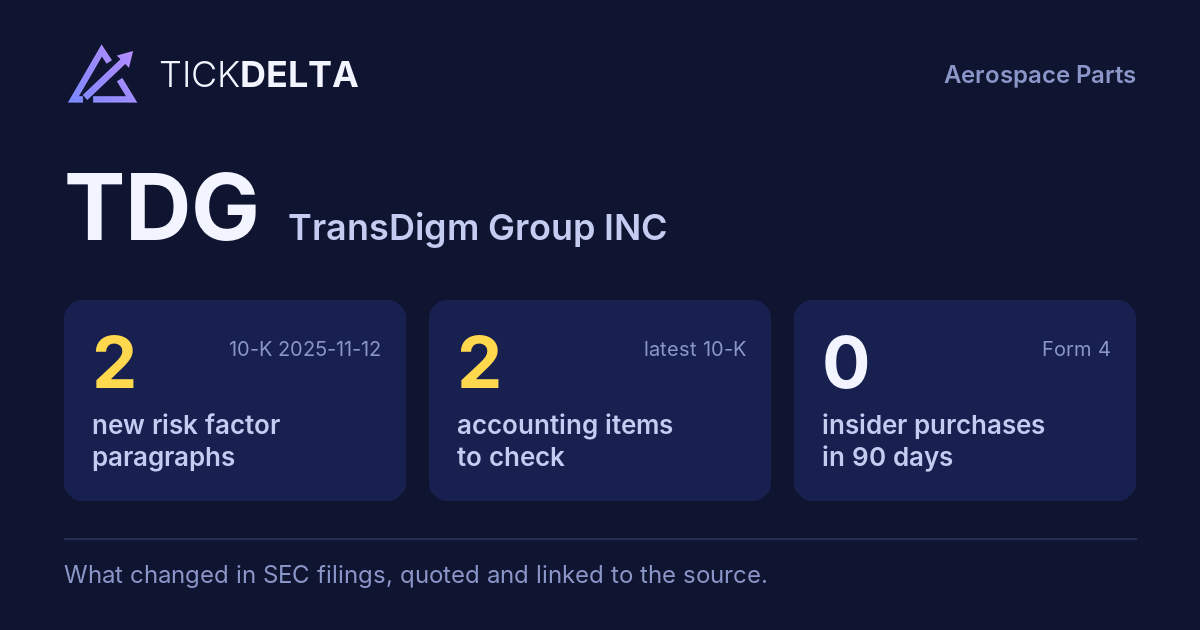
3 new risk paragraphs. 10-K filed Nov 10, 2026 against Nov 12, 2025.
Each row opens the detail with the quote and the filing. A row is a change worth reading, not a verdict.
Accounting checks
11 checks on the latest 10-K. Checks, not verdicts.
0facts worth reading about all 11 checks found nothing to note
-
Receivables +27.0% vs revenue +19.5% (+7.5 pts)
-
Cash from operations $2.2B vs net income $2.1B (FY ending Sep 30, 2026)
-
Inventory +29.5% vs revenue +19.5% (+10.0 pts)
8 more checks with nothing to note
-
Same auditor in both 10-Ks: Ernst & Young LLP
-
No statement of substantial doubt about going concern
-
No 8-K item 4.02 in the last 2 years
-
No NT 10-K or NT 10-Q in the last 2 years
-
The same matters as last year: F-1; Annual assessment of goodwill for impairment
-
No sentence in the 10-K concludes that controls were not effective because of a material weakness
-
No 8-K item 2.06 in the last 2 years
-
No 8-K item 1.03 in the last 2 years
In their words
3 paragraphs in Risk Factors that were not in the 10-K filed Nov 12, 2025. Quoted as filed.
-
Item 1A · new paragraph · not in the 10-K filed Nov 12, 2025 10-K, ITEM 1A
Regulation that would have a material adverse impact on air travel could also have a material adverse impact on our business. Given the uncertainty around these issues, we cannot predict how future legislation will affect our operations and financial condition.
-
Item 1A · new paragraph · not in the 10-K filed Nov 12, 2025 10-K, ITEM 1A
Common stock repurchases under our capital allocation strategy are subject to uncertainties of the market and may affect our common stock price. Common stock repurchases are one component of our capital allocation strategy. We generally prioritize in the following manner: (1) investing capital in existing businesses, (2) acquisitions of…
New risk paragraphs, against peers
Latest 10-K of each, Industrials companies closest in revenue
Paragraphs in Risk Factors with nothing like them in the company's 10-K the year before. A count of text, not of risk.
Financial performance
Last 4 fiscal years · 10-K XBRL
| Metric | FY2023 | FY2024 | FY2025 | FY2026 |
|---|---|---|---|---|
| Revenue | $6.6B | $7.9B | $8.8B | $10.6B |
| Net income | $1.3B | $1.7B | $2.1B | $2.1B |
| Operating cash flow | $1.4B | $2.0B | $2.0B | $2.2B |
| Free cash flow | $1.2B | $1.9B | $1.8B | $1.9B |
Revenue, FY2017 to FY2026
Ten fiscal years, each from its own 10-K · XBRL · USD
$10.6B ▲ 19.5% in FY2026$2.1B ▲ 1.6% in FY2026$1.9B ▲ 5.3% in FY2026
Recent filings
2 filings in the last 30 days · SEC EDGAR
-
8-KNov 10, 2026Quarterly results 8-K item 2.02
-
10-KNov 10, 2026Annual report (10-K) period ended Sep 30, 2026
About the company
TransDigm Group, Cleveland, OH · from the 10-K filed Nov 10, 2026
TD Group, through its wholly-owned subsidiary, TransDigm Inc., is a leading global designer, producer and supplier of highly engineered aircraft components that are critical to the safe and effective operation of nearly all commercial and military aircraft worldwide. Our products are represented in nearly every commercial and military aircraft in service today. Our business is well diversified due to the broad range of products we offer to our customers.
- Headquarters
- Cleveland, OH
- Country
- United States
- Reports in
- USD
- Listed on
- NYSE
- Fiscal year ends
- September 30
- Last results
- Nov 10, 2026
- Incorporated in
- DE
Email alerts
Sources
The 10-K filed Nov 10, 2026 (open at SEC), compared with the 10-K filed Nov 12, 2025. Numbers from the XBRL of the 10-Ks; filings from SEC EDGAR.
Work with it: Excel workbook · CSV. Google Sheet that stays up to date: paste =IMPORTDATA("https://tickdelta.com/company/TDG/export.csv") into a cell.