United Natural Foods Inc UNFI
UNFI is a leading grocery wholesaler and support services provider to retailers in the United States and Canada. 10-K, Item 1
- Headquarters
- Providence, RI
- CEO
- J. Alexander Douglas Jr
- Next results
- around Dec 1, 2026
Where each dollar of revenue went, FY2026
Revenue of $31.2B through the costs to a net profit of $84.0M · income statement of the 10-K
UNFI among Consumer staples peers
Six ratios from the latest 10-K. Each corner is the share of 63 peers the company is above, not a score.
What changed
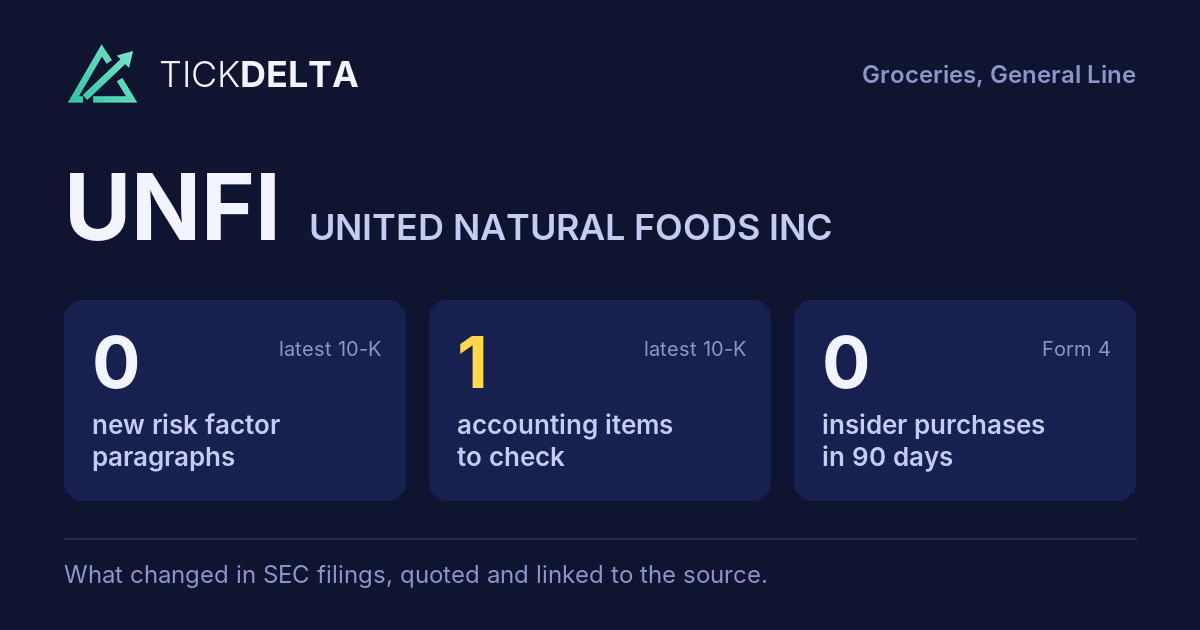
1 accounting fact worth reading about.
Each row opens the detail with the quote and the filing. A row is a change worth reading, not a verdict.
Accounting checks
11 checks on the latest 10-K. Checks, not verdicts.
1fact worth reading about the other 10 checks found nothing to note
-
Critical audit matters changedNew this year: Sufficiency of audit evidence over inventory quantities (“As discussed in Note 1 to the consolidated financial statements, the Company held $1,946 million of inventory, net as of August 1, 2026, the majority of which was located across 46 distribution centers and warehouses. The Company’s processes to track and determine consolidated inventory rely on vari”). No longer listed: Assessment of the value of the defined benefit pension obligation
-
Receivables -16.3% ($1.1B to $889.0M) vs revenue -2.0% ($31.8B to $31.2B), -14.3 pts apart
9 more checks with nothing to note
-
Cash from operations $540.0M vs net income $84.0M (FY ending Aug 1, 2026)
-
Inventory -7.1% ($2.1B to $1.9B) vs revenue -2.0% ($31.8B to $31.2B), -5.1 pts apart
-
Same auditor in both 10-Ks: KPMG LLP
-
No statement of substantial doubt about going concern
-
No 8-K item 4.02 in the last 2 years
-
No NT 10-K or NT 10-Q in the last 2 years
-
No sentence in the 10-K concludes that controls were not effective because of a material weakness
-
No 8-K item 2.06 in the last 2 years
-
No 8-K item 1.03 in the last 2 years
In their words
No new paragraphs in Risk Factors
No new paragraphs in Risk Factors, or fewer than two 10-Ks to compare.
New risk paragraphs, against peers
Latest 10-K of each, Consumer staples companies closest in revenue
Paragraphs in Risk Factors with nothing like them in the company's 10-K the year before. A count of text, not of risk.
Financial performance
Last 4 fiscal years · 10-K XBRL
| Metric | FY2023 | FY2024 | FY2025 | FY2026 |
|---|---|---|---|---|
| Revenue | $30.3B | $31.0B | $31.8B | $31.2B |
| Net income | $24.0M | −$112.0M | −$118.0M | $84.0M |
| Operating cash flow | $624.0M | $253.0M | $470.0M | $540.0M |
| Free cash flow | $301.0M | −$92.0M | $239.0M | $323.0M |
Revenue, FY2017 to FY2026
Ten fiscal years, each from its own 10-K · XBRL · USD
$31.2B ▼ 2.0% in FY2026$84.0M in FY2026$323.0M ▲ 35.1% in FY2026
Recent filings
No new filings in the last 30 days · SEC EDGAR
Nothing new. The most recent filings:
-
10-KSep 14, 2026Annual report (10-K) period ended Aug 1, 2026
-
8-KSep 8, 2026Quarterly results, Other events 8-K items 2.02, 8.01
-
OfficerJul 9, 2026CFO and COO change (the “Company”) appointed Giorgio Matteo Tarditi, the Company’s current President and Chief Financial Officer, as the Company’s President and Chief Operating Officer, and Louis Martin, the Company’s current President of Conventional Grocery Products and UNFI Chief Commercial Officer, as Chief Commercial Officer, effective on August 3, 2026 (the “Effective Date”).
-
Planned saleJun 23, 2026Bushway Mark (Officer) gave notice of a planned sale of 10,000 shares worth about $516K Form 144, approximate sale date Jun 23, 2026
About the company
United Natural Foods Inc, Providence, RI · from the 10-K filed Sep 14, 2026
UNFI is a leading grocery wholesaler and support services provider to retailers in the United States and Canada. We believe our broad array of products, data, insights, programs and services uniquely positions us to help meet a wide range of customer and supplier needs across North America. Our diversified customer base includes over 30,000 customer locations ranging from some of the largest grocers in North America to smaller retailers.
- Headquarters
- Providence, RI
- Country
- United States
- Reports in
- USD
- Listed on
- NYSE
- Fiscal year ends
- July 31
- Last results
- Sep 8, 2026
- Incorporated in
- DE
Email alerts
Sources
Numbers from the XBRL of the 10-Ks; filings from SEC EDGAR.
Work with it: Excel workbook · CSV. Google Sheet that stays up to date: paste =IMPORTDATA("https://tickdelta.com/company/UNFI/export.csv") into a cell.