Dover Corporation DOV
- Employees
- 24,000
- Headquarters
- Downers Grove, IL
- CEO
- Richard J. Tobin
- Next results
- around Jan 28, 2027
Where each dollar of revenue went, FY2025
Revenue of $8.1B through the costs to a net profit of $1.1B · income statement of the 10-K
DOV among Industrials peers
Six ratios from the latest 10-K. Each corner is the share of 81 peers the company is above, not a score.
What changed
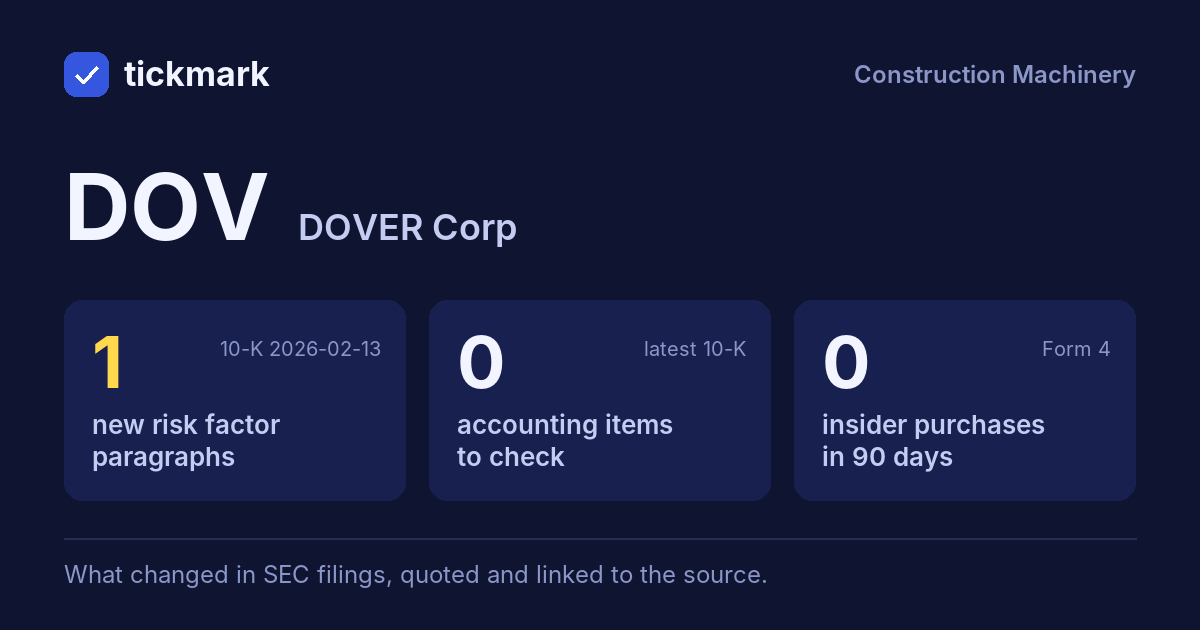
1 new risk paragraph. 10-K filed Feb 13, 2026 against Feb 14, 2025.
Each row opens the detail with the quote and the filing. A row is a change worth reading, not a verdict.
Accounting checks
11 checks on the latest 10-K. Checks, not verdicts.
0facts worth reading about all 11 checks found nothing to note
-
Receivables +1.3% vs revenue +4.5% (-3.2 pts)
-
Cash from operations $1.3B vs net income $1.1B (FY ending Dec 31, 2025)
-
Inventory +11.2% vs revenue +4.5% (+6.7 pts)
8 more checks with nothing to note
-
Same auditor in both 10-Ks: PricewaterhouseCoopers LLP
-
No statement of substantial doubt about going concern
-
No 8-K item 4.02 in the last 2 years
-
No NT 10-K or NT 10-Q in the last 2 years
-
The same matters as last year: Goodwill Impairment Test
-
No sentence in the 10-K concludes that controls were not effective because of a material weakness
-
No 8-K item 2.06 in the last 2 years
-
No 8-K item 1.03 in the last 2 years
In their words
1 paragraph in Risk Factors that was not in the 10-K filed Feb 14, 2025. Quoted as filed.
-
Item 1A · new paragraph · not in the 10-K filed Feb 14, 2025 10-K, ITEM 1A
changes relating to climate change related policies, they could lose customers to competitors. If our businesses do not compete effectively, we may experience lower revenue, operating profits and cash flows.
New risk paragraphs, against peers
Latest 10-K of each, Industrials companies closest in revenue
Paragraphs in Risk Factors with nothing like them in the company's 10-K the year before. A count of text, not of risk.
Financial performance
Last 4 fiscal years · 10-K XBRL
| Metric | FY2022 | FY2023 | FY2024 | FY2025 |
|---|---|---|---|---|
| Revenue | $7.8B | $7.7B | $7.7B | $8.1B |
| Net income | $1.1B | $1.1B | $2.7B | $1.1B |
| Operating cash flow | $805.7M | $1.3B | $1.1B | $1.3B |
| Free cash flow | $594.6M | $1.2B | $920.3M | $1.1B |
Revenue, FY2016 to FY2025
Ten fiscal years, each from its own 10-K · XBRL · USD
$8.1B ▲ 4.5% in FY2025$1.1B ▼ 59.4% in FY2025$1.1B ▲ 21.5% in FY2025
Recent filings
3 filings in the last 30 days · SEC EDGAR
-
8-KNov 2, 2026Other events 8-K item 8.01
-
8-KOct 22, 2026Quarterly results, Regulation FD disclosure 8-K items 2.02, 7.01
-
10-QOct 22, 2026Quarterly report (10-Q) period ended Sep 30, 2026
About the company
Dover Corporation, Downers Grove, IL · from the 10-K filed Feb 13, 2026
Dover Corporation is a diversified global manufacturer and solutions provider delivering innovative equipment and components, consumable supplies, aftermarket parts, software and digital solutions and support services through five operating segments: Engineered Products, Clean Energy & Fueling, Imaging & Identification, Pumps & Process Solutions, and Climate & Sustainability Technologies. Unless the context indicates otherwise, references herein to "Dover," "the Company," and words such as "we," "us," or "our" include Dover Corporation and its consolidated subsidiaries. Dover was incorporated in 1947 in the State of Delaware and became a publicly traded company in 1955.
- Headquarters
- Downers Grove, IL
- Country
- United States
- Reports in
- USD
- Listed on
- NYSE
- Fiscal year ends
- December 31
- Last results
- Oct 22, 2026
- Incorporated in
- NY
Employees, at the top of the page: "Dover is headquartered in Downers Grove, Illinois and currently employs approximately 24,000 people worldwide" (10-K). Address and exchange: SEC's company file.
Email alerts
Sources
The 10-K filed Feb 13, 2026 (open at SEC), compared with the 10-K filed Feb 14, 2025. Numbers from the XBRL of the 10-Ks; filings from SEC EDGAR.
Work with it: Excel workbook · CSV. Google Sheet that stays up to date: paste =IMPORTDATA("https://tickdelta.com/company/DOV/export.csv") into a cell.