MSA Safety Inc MSA
Overview - MSA Safety Incorporated (the "Company" or "MSA") is the global leader in advanced safety products, technology and solutions. 10-K, Item 1
- Employees
- 5,300
- Headquarters
- Cranberry Township, PA
- CEO
- Steven C. Blanco Sr.
- Next results
- around Feb 10, 2027
Where each dollar of revenue went, FY2025
Revenue of $1.9B through the costs to a net profit of $278.9M · income statement of the 10-K
MSA among Health care peers
Six ratios from the latest 10-K. Each corner is the share of 154 peers the company is above, not a score.
What changed
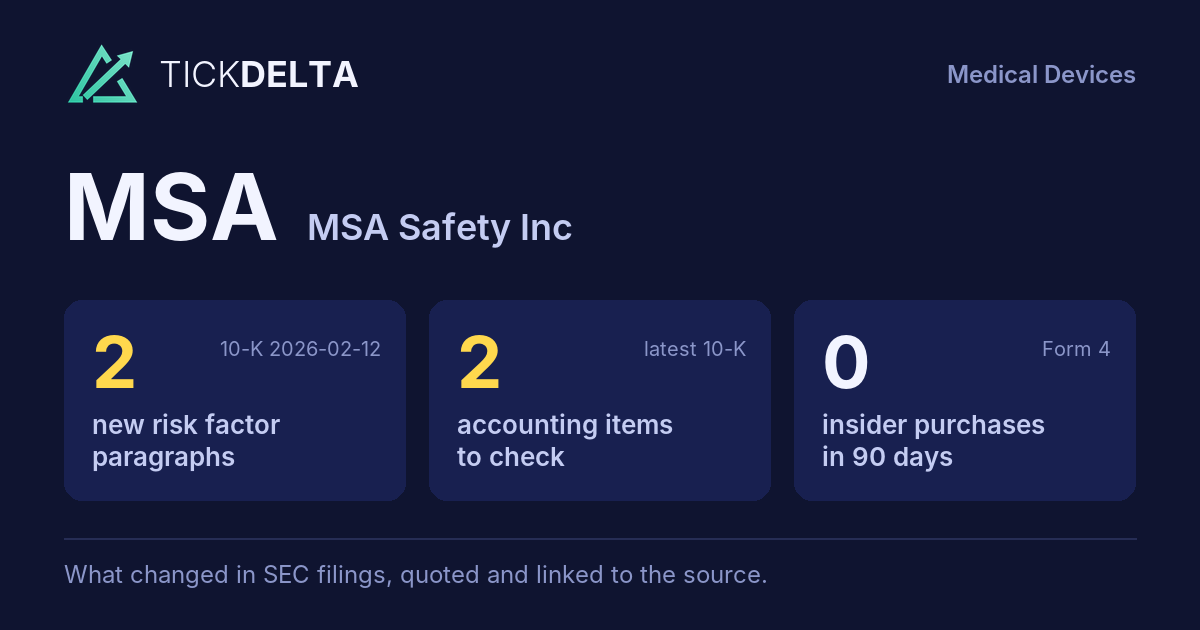
2 new risk paragraphs and 2 accounting facts worth reading about. 10-K filed Feb 12, 2026 against Feb 14, 2025.
Each row opens the detail with the quote and the filing. A row is a change worth reading, not a verdict.
Accounting checks
11 checks on the latest 10-K. Checks, not verdicts.
2facts worth reading about the other 9 checks found nothing to note
-
Inventory growing faster than revenueInventory +15.6% ($296.8M to $343.0M) vs revenue +3.7% ($1.8B to $1.9B), +11.9 pts apart
-
Critical audit matters changedNew this year: Goodwill impairment assessment – Europe reporting unit (“At December 31, 2025, the Company had goodwill of approximately $731.6 million on its consolidated balance sheet, of which $247.8 million is at the Europe reporting unit. As discussed in Note 1 to the consolidated financial statements, the Company evaluates goodwill for impairment annually, or more ”). No longer listed: Valuation of Goodwill
-
Receivables +9.8% ($279.2M to $306.5M) vs revenue +3.7% ($1.8B to $1.9B), +6.1 pts apart
8 more checks with nothing to note
-
Cash from operations $363.9M vs net income $278.9M (FY ending Dec 31, 2025)
-
Same auditor in both 10-Ks: Ernst & Young LLP
-
No statement of substantial doubt about going concern
-
No 8-K item 4.02 in the last 2 years
-
No NT 10-K or NT 10-Q in the last 2 years
-
No sentence in the 10-K concludes that controls were not effective because of a material weakness
-
No 8-K item 2.06 in the last 2 years
-
No 8-K item 1.03 in the last 2 years
In their words
2 paragraphs in Risk Factors that were not in the 10-K filed Feb 14, 2025. Quoted as filed.
-
Item 1A · new paragraph · not in the 10-K filed Feb 14, 2025 10-K, ITEM 1A
•nationalization and expropriation of assets (or laws that effectively result in the same);
-
Item 1A · new paragraph · not in the 10-K filed Feb 14, 2025 10-K, ITEM 1A
•risks associated with restricted or delayed access to capital markets on acceptable terms necessary to execute our business strategy, fund operations, refinance existing indebtedness, and pursue strategic opportunities;
New risk paragraphs, against peers
Latest 10-K of each, Health care companies closest in revenue
Paragraphs in Risk Factors with nothing like them in the company's 10-K the year before. A count of text, not of risk.
Financial performance
Last 4 fiscal years · 10-K XBRL
| Metric | FY2022 | FY2023 | FY2024 | FY2025 |
|---|---|---|---|---|
| Revenue | $1.5B | $1.8B | $1.8B | $1.9B |
| Net income | $179.6M | $58.6M | $285.0M | $278.9M |
| Operating cash flow | $157.5M | $92.9M | $296.4M | $363.9M |
| Free cash flow | $114.9M | $50.1M | $242.2M | $295.4M |
Revenue, FY2016 to FY2025
Ten fiscal years, each from its own 10-K · XBRL · USD
$1.9B ▲ 3.7% in FY2025$278.9M ▼ 2.1% in FY2025$295.4M ▲ 22.0% in FY2025
Recent filings
2 filings in the last 30 days · SEC EDGAR
-
10-QNov 3, 2026Quarterly report (10-Q) period ended Sep 30, 2026
-
8-KNov 2, 2026Quarterly results 8-K item 2.02
About the company
MSA Safety Inc, Cranberry Township, PA · from the 10-K filed Feb 12, 2026
Overview - MSA Safety Incorporated (the "Company" or "MSA") is the global leader in advanced safety products, technology and solutions. Driven by its singular mission of safety, the Company has been at the forefront of safety innovation since 1914, protecting workers and facility infrastructure around the world across a broad range of diverse end markets while creating sustainable value for shareholders.
- Headquarters
- Cranberry Township, PA
- Country
- United States
- Reports in
- USD
- Listed on
- NYSE, OTC
- Fiscal year ends
- December 31
- Last results
- Nov 2, 2026
Employees, at the top of the page: "Human Capital - As of December 31, 2025, the Company employed approximately 5,300 people worldwide, of which approximately 2,200 were employed in the United States and 3,100 were employed outside of the United States" (10-K). Address and exchange: SEC's company file.
Email alerts
Sources
The 10-K filed Feb 12, 2026 (open at SEC), compared with the 10-K filed Feb 14, 2025. Numbers from the XBRL of the 10-Ks; filings from SEC EDGAR.
Work with it: Excel workbook · CSV. Google Sheet that stays up to date: paste =IMPORTDATA("https://tickdelta.com/company/MSA/export.csv") into a cell.