Procter & Gamble PG
- Employees
- 104,000
- Headquarters
- Cincinnati, OH
- CEO
- Shailesh Jejurikar
- Next results
- around Jan 21, 2027
Where each dollar of revenue went, FY2026
Revenue of $87.0B through the costs to a net profit of $16.0B · income statement of the 10-K
PG among Consumer staples peers
Six ratios from the latest 10-K. Each corner is the share of 32 peers the company is above, not a score.
What changed
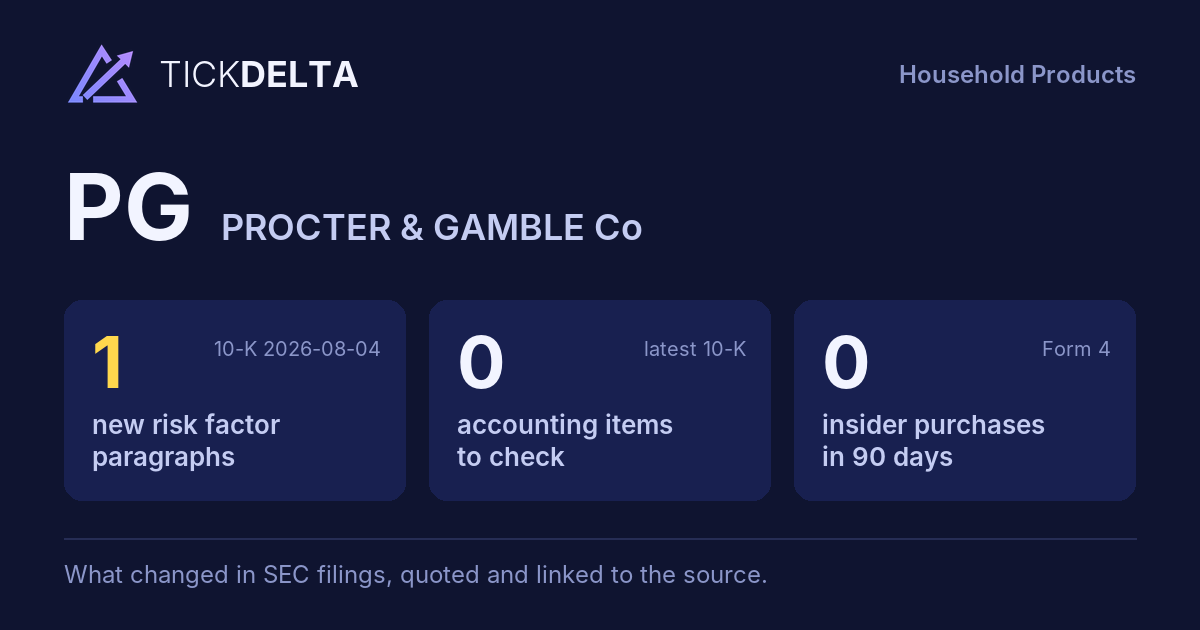
1 new risk paragraph. 10-K filed Aug 4, 2026 against Aug 4, 2025.
Each row opens the detail with the quote and the filing. A row is a change worth reading, not a verdict.
Accounting checks
11 checks on the latest 10-K. Checks, not verdicts.
0facts worth reading about all 11 checks found nothing to note
-
Receivables -2.1% vs revenue +3.3% (-5.3 pts)
-
Cash from operations $19.6B vs net income $16.0B (FY ending Jun 30, 2026)
-
Inventory +8.2% vs revenue +3.3% (+4.9 pts)
8 more checks with nothing to note
-
Same auditor in both 10-Ks: Deloitte & Touche LLP
-
No statement of substantial doubt about going concern
-
No 8-K item 4.02 in the last 2 years
-
No NT 10-K or NT 10-Q in the last 2 years
-
The same matters as last year: Intangible Assets - Gillette Indefinite-Lived Intangible Asset
-
No sentence in the 10-K concludes that controls were not effective because of a material weakness
-
No 8-K item 2.06 in the last 2 years
-
No 8-K item 1.03 in the last 2 years
In their words
1 paragraph in Risk Factors that was not in the 10-K filed Aug 4, 2025. Quoted as filed.
-
Item 1A · new paragraph · not in the 10-K filed Aug 4, 2025 10-K, ITEM 1A
The conflict in the Middle East could also adversely impact our financial results and operations due to, for example, volatility in global energy markets, supply chain disruptions, inflationary pressures or trade restrictions.
New risk paragraphs, against peers
Latest 10-K of each, Consumer staples companies closest in revenue
Paragraphs in Risk Factors with nothing like them in the company's 10-K the year before. A count of text, not of risk.
Financial performance
Last 4 fiscal years · 10-K XBRL
| Metric | FY2023 | FY2024 | FY2025 | FY2026 |
|---|---|---|---|---|
| Revenue | $82.0B | $84.0B | $84.3B | $87.0B |
| Net income | $14.7B | $14.9B | $16.0B | $16.0B |
| Operating cash flow | $16.8B | $19.8B | $17.8B | $19.6B |
| Free cash flow | $13.8B | $16.5B | $14.0B | $15.1B |
Revenue, FY2017 to FY2026
Ten fiscal years, each from its own 10-K · XBRL · USD
$87.0B ▲ 3.3% in FY2026$16.0B ▲ 0.5% in FY2026$15.1B ▲ 7.9% in FY2026
Recent filings
9 filings in the last 30 days · SEC EDGAR
-
8-KNov 3, 2026Other events 8-K item 8.01
-
8-KNov 2, 2026Other events 8-K item 8.01
-
8-KOct 30, 2026Other events 8-K item 8.01
-
8-KOct 22, 2026Quarterly results 8-K item 2.02
-
8-KOct 22, 2026Regulation FD disclosure 8-K item 7.01
About the company
Procter & Gamble, Cincinnati, OH · from the 10-K filed Aug 4, 2026
The Procter & Gamble Company (the Company) is a world-leading multinational consumer goods company focused on providing trusted, branded products of superior quality, performance and value to improve the lives of consumers around the world - now and for generations to come. Our products are sold in about 180 countries and territories throughout the world. The Company was incorporated in Ohio in 1905, having first been established as a New Jersey corporation in 1890, and was built from a business founded in Cincinnati in 1837 by William Procter and James Gamble.
- Headquarters
- Cincinnati, OH
- Country
- United States
- Reports in
- USD
- Listed on
- NYSE
- Fiscal year ends
- June 30
- Last results
- Oct 22, 2026
- Incorporated in
- OH
Employees, at the top of the page: "As of June 30, 2026, the Company had approximately 104,000 employees, a decrease of 4% versus the prior year due to the ongoing restructuring program" (10-K). Address and exchange: SEC's company file.
Email alerts
Sources
The 10-K filed Aug 4, 2026 (open at SEC), compared with the 10-K filed Aug 4, 2025. Numbers from the XBRL of the 10-Ks; filings from SEC EDGAR.
Work with it: Excel workbook · CSV. Google Sheet that stays up to date: paste =IMPORTDATA("https://tickdelta.com/company/PG/export.csv") into a cell.