Terex Corp TEX
Our Company was incorporated in Delaware in October 1986 as Terex U.S.A., Inc. 10-K, Item 1
- Employees
- 10,700
- Headquarters
- Norwalk, CT
- CEO
- Simon Meester
- Next results
- around Feb 10, 2027
Where each dollar of revenue went, FY2025
Revenue of $5.4B through the costs to a net profit of $221.0M · income statement of the 10-K
TEX among Industrials peers
Six ratios from the latest 10-K. Each corner is the share of 251 peers the company is above, not a score.
What changed
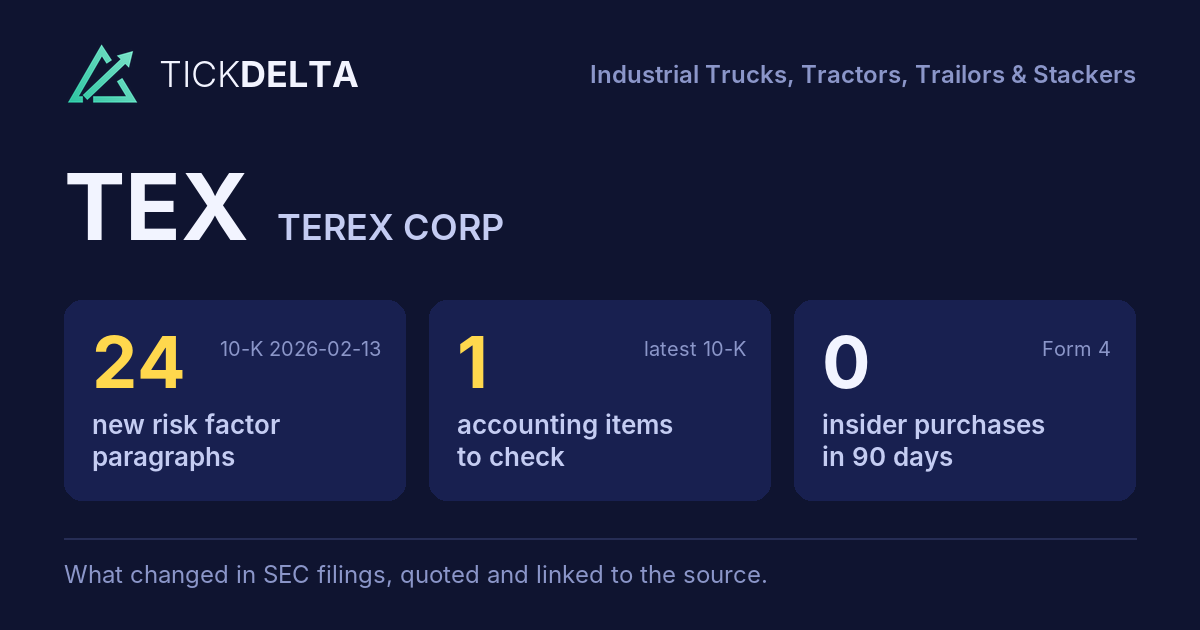
24 new risk paragraphs and 1 accounting fact worth reading about. 10-K filed Feb 13, 2026 against Feb 7, 2025.
Each row opens the detail with the quote and the filing. A row is a change worth reading, not a verdict.
Accounting checks
11 checks on the latest 10-K. Checks, not verdicts.
1fact worth reading about the other 10 checks found nothing to note
-
Critical audit matters changedNew this year: Sufficiency of audit evidence over inventory quantities (“As discussed in Notes A and F to the consolidated financial statements, the Company held $1,109 million of inventory, which was held at a large number of locations, as of December 31, 2025. Inventories are primarily comprised of raw materials, work-in-process, and finished goods that are physically ”). No longer listed: Fair Value of Acquired Customer Relationship Intangible Asset
-
Receivables +10.7% ($643.0M to $712.0M) vs revenue +5.7% ($5.1B to $5.4B), +5.0 pts apart
9 more checks with nothing to note
-
Cash from operations $440.0M vs net income $221.0M (FY ending Dec 31, 2025)
-
Inventory -3.3% ($1.1B to $1.1B) vs revenue +5.7% ($5.1B to $5.4B), -9.0 pts apart
-
Same auditor in both 10-Ks: KPMG LLP
-
No statement of substantial doubt about going concern
-
No 8-K item 4.02 in the last 2 years
-
No NT 10-K or NT 10-Q in the last 2 years
-
No sentence in the 10-K concludes that controls were not effective because of a material weakness
-
No 8-K item 2.06 in the last 2 years
-
No 8-K item 1.03 in the last 2 years
In their words
24 paragraphs in Risk Factors that were not in the 10-K filed Feb 7, 2025. Quoted as filed.
-
Item 1A · new paragraph · not in the 10-K filed Feb 7, 2025 10-K, ITEM 1A
Our results after the completion of the REV Transaction may be adversely impacted if we do not effectively manage our expanded operations following the completion of the REV Transaction. Following the recent REV Transaction, the size of our business is now significantly larger. Our ability to successfully manage this expanded business…
-
Item 1A · new paragraph · not in the 10-K filed Feb 7, 2025 10-K, ITEM 1A
Certain of our businesses depend on the performance of dealers and disruptions within our dealer network could have a negative effect on our business. Certain of our businesses rely on their independent dealer networks to sell our products to end customers. Such businesses are therefore affected by our ability to establish new…
-
Item 1A · new paragraph · not in the 10-K filed Feb 7, 2025 10-K, ITEM 1A
Demand for our products is affected by the general strength of the economies in which we sell our products, customers’ perceptions concerning the timing of economic cycles, customers’ replacement or repair cycles, prevailing interest rates,
-
Item 1A · new paragraph · not in the 10-K filed Feb 7, 2025 10-K, ITEM 1A
Certain of our businesses depend upon continued federal, state, and local government expenditures, which have not always remained constant over time. Current government spending levels on programs our businesses support may not be sustainable as a result of changes in government leadership, policies or priorities. Certain of our sales…
New risk paragraphs, against peers
Latest 10-K of each, Industrials companies closest in revenue
Paragraphs in Risk Factors with nothing like them in the company's 10-K the year before. A count of text, not of risk.
Financial performance
Last 4 fiscal years · 10-K XBRL
| Metric | FY2022 | FY2023 | FY2024 | FY2025 |
|---|---|---|---|---|
| Revenue | $4.4B | $5.2B | $5.1B | $5.4B |
| Net income | $300.0M | $518.0M | $335.0M | $221.0M |
| Operating cash flow | $261.0M | $459.0M | $326.0M | $440.0M |
| Free cash flow | $151.0M | $332.0M | $189.0M | $322.0M |
Revenue, FY2016 to FY2025
Ten fiscal years, each from its own 10-K · XBRL · USD
$5.4B ▲ 5.7% in FY2025$221.0M ▼ 34.0% in FY2025$322.0M ▲ 70.4% in FY2025
Recent filings
4 filings in the last 30 days · SEC EDGAR
-
8-KNov 12, 2026Director or officer change 8-K item 5.02
-
8-KOct 30, 2026Quarterly results 8-K item 2.02
-
10-QOct 29, 2026Quarterly report (10-Q) period ended Sep 30, 2026
-
8-KOct 28, 2026Quarterly results, Regulation FD disclosure 8-K items 2.02, 7.01
About the company
Terex Corp, Norwalk, CT · from the 10-K filed Feb 13, 2026
Our Company was incorporated in Delaware in October 1986 as Terex U.S.A., Inc. Since that time, we have changed significantly, and much of this change has been historically accomplished through acquisitions and managing our portfolio of companies by divestiture of non-core businesses and products. Today, Terex is a global industrial equipment manufacturer of materials processing machinery, waste and recycling solutions, mobile elevating work platforms (MEWPs), and equipment for the electric utility industry. We design, build and support products used in maintenance, manufacturing, energy, waste and recycling, minerals and materials management, construction, and the entertainment industry.
- Headquarters
- Norwalk, CT
- Country
- United States
- Reports in
- USD
- Listed on
- NYSE
- Fiscal year ends
- December 31
- Last results
- Oct 30, 2026
- Incorporated in
- DE
Employees, at the top of the page: "As of December 31, 2025, we had approximately 10,700 team members, including approximately 5,700 team members in the U" (10-K). Address and exchange: SEC's company file.
Email alerts
Sources
The 10-K filed Feb 13, 2026 (open at SEC), compared with the 10-K filed Feb 7, 2025. Numbers from the XBRL of the 10-Ks; filings from SEC EDGAR.
Work with it: Excel workbook · CSV. Google Sheet that stays up to date: paste =IMPORTDATA("https://tickdelta.com/company/TEX/export.csv") into a cell.