Valmont Industries Inc VMI
Valmont Industries, Inc., along with its subsidiaries (collectively referred to as the “Company,” “Valmont,” “we,” “us,” or “our”), is a diversified manufacturer of products and services for infrastructure and agriculture markets. 10-K, Item 1
- Employees
- 10,791
- Headquarters
- Omaha, NE
- CEO
- Avner M. Applbaum
- Next results
- around Feb 16, 2027
Where each dollar of revenue went, FY2025
Revenue of $4.1B through the costs to a net profit of $350.3M · income statement of the 10-K
VMI among Industrials peers
Six ratios from the latest 10-K. Each corner is the share of 251 peers the company is above, not a score.
What changed
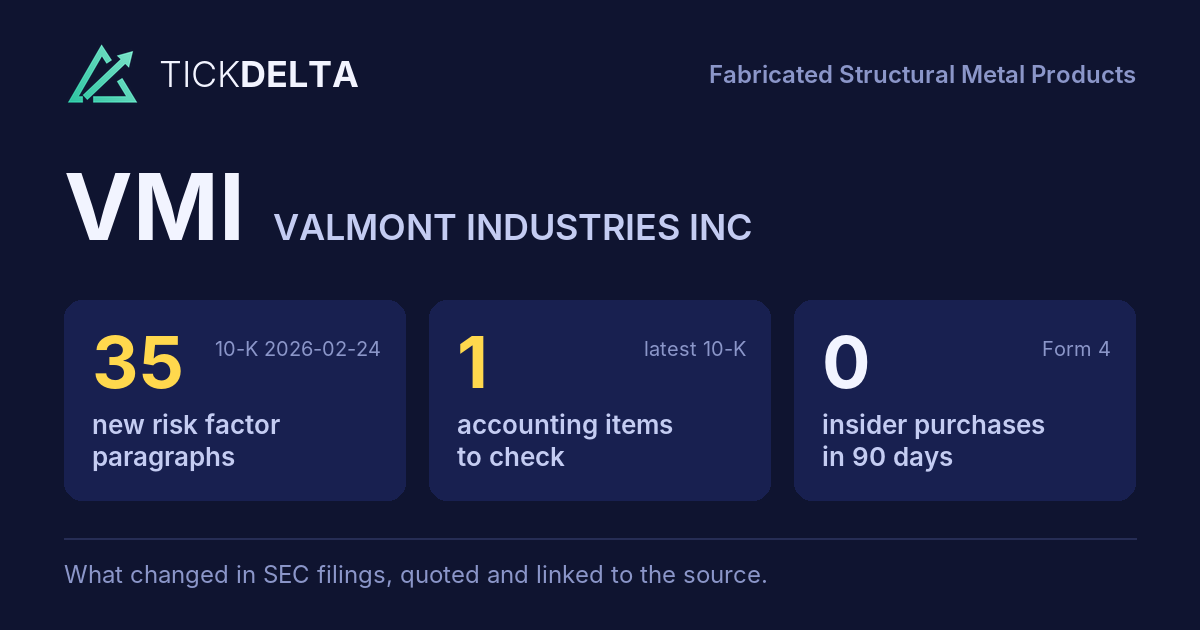
35 new risk paragraphs and 1 accounting fact worth reading about. 10-K filed Feb 24, 2026 against Feb 25, 2025.
Each row opens the detail with the quote and the filing. A row is a change worth reading, not a verdict.
Accounting checks
11 checks on the latest 10-K. Checks, not verdicts.
1fact worth reading about the other 10 checks found nothing to note
-
Auditor change8-K item 4.01 (change in certifying accountant) filed Mar 6, 2026
-
Receivables -9.8% ($654.4M to $590.1M) vs revenue +0.7% ($4.1B to $4.1B), -10.5 pts apart
9 more checks with nothing to note
-
Cash from operations $456.5M vs net income $350.3M (FY ending Dec 27, 2025)
-
Inventory -4.0% ($590.3M to $566.4M) vs revenue +0.7% ($4.1B to $4.1B), -4.8 pts apart
-
No statement of substantial doubt about going concern
-
No 8-K item 4.02 in the last 2 years
-
No NT 10-K or NT 10-Q in the last 2 years
-
The same matters as last year: Goodwill
-
No sentence in the 10-K concludes that controls were not effective because of a material weakness
-
No 8-K item 2.06 in the last 2 years
-
No 8-K item 1.03 in the last 2 years
In their words
35 paragraphs in Risk Factors that were not in the 10-K filed Feb 25, 2025. Quoted as filed.
-
Item 1A · new paragraph · not in the 10-K filed Feb 25, 2025 10-K, ITEM 1A
Our ability to effectively manage the procurement and inventory of key components and raw materials may be adversely affected by supply disruptions and demand volatility, which could reduce our profitability. Our Agriculture and Infrastructure businesses are subject to pronounced business cycles and, at times, sudden changes in customer…
-
Item 1A · new paragraph · not in the 10-K filed Feb 25, 2025 10-K, ITEM 1A
Adverse economic conditions, particularly in certain international markets, could impair the collectability of our accounts receivable and adversely affect our operating results. Adverse economic conditions in certain international regions, most notably Brazil, may increase our exposure to credit losses resulting from financial…
-
Item 1A · new paragraph · not in the 10-K filed Feb 25, 2025 10-K, ITEM 1A
Recent and ongoing tariff actions affecting steel, aluminum, and goods imported from Canada, China, and Mexico, have increased uncertainty regarding the cost and availability of raw materials and components critical to our manufacturing operations. These actions, as well as any future changes in tariffs, trade agreements, or the…
-
Item 1A · new paragraph · not in the 10-K filed Feb 25, 2025 10-K, ITEM 1A
Changes in the application and enforcement of U.S. trade and tariff laws, including Section 232 tariffs on steel and aluminum content, could increase our costs and adversely affect our results of operations. We manufacture Utility structures in Mexico and ship them to customers in the U.S. While most of the structures we sell to U.S.…
New risk paragraphs, against peers
Latest 10-K of each, Industrials companies closest in revenue
Paragraphs in Risk Factors with nothing like them in the company's 10-K the year before. A count of text, not of risk.
Financial performance
Last 4 fiscal years · 10-K XBRL
| Metric | FY2022 | FY2023 | FY2024 | FY2025 |
|---|---|---|---|---|
| Revenue | $4.3B | $4.2B | $4.1B | $4.1B |
| Net income | $250.9M | $150.8M | $348.3M | $350.3M |
| Operating cash flow | $326.3M | $306.8M | $572.7M | $456.5M |
| Free cash flow | $233.0M | $210.0M | $493.2M | $311.4M |
Revenue, FY2017 to FY2025
Ten fiscal years, each from its own 10-K · XBRL · USD
$4.1B ▲ 0.7% in FY2025$350.3M ▲ 0.6% in FY2025$311.4M ▼ 36.9% in FY2025
Recent filings
2 filings in the last 30 days · SEC EDGAR
-
10-QOct 27, 2026Quarterly report (10-Q) period ended Sep 26, 2026
-
8-KOct 20, 2026Quarterly results 8-K item 2.02
About the company
Valmont Industries Inc, Omaha, NE · from the 10-K filed Feb 24, 2026
Valmont Industries, Inc., along with its subsidiaries (collectively referred to as the “Company,” “Valmont,” “we,” “us,” or “our”), is a diversified manufacturer of products and services for infrastructure and agriculture markets. Founded in 1946 and headquartered in Omaha, Nebraska, our purpose is to conserve resources and improve life. We have been publicly traded since 1968, with our shares listed on the New York Stock Exchange under the ticker symbol “VMI.”
- Headquarters
- Omaha, NE
- Country
- United States
- Reports in
- USD
- Listed on
- NYSE
- Fiscal year ends
- December 26
- Last results
- Oct 20, 2026
- Incorporated in
- DE
Employees, at the top of the page: "As of December 27, 2025, we had a total of 10,791 employees" (10-K). Address and exchange: SEC's company file.
Email alerts
Sources
The 10-K filed Feb 24, 2026 (open at SEC), compared with the 10-K filed Feb 25, 2025. Numbers from the XBRL of the 10-Ks; filings from SEC EDGAR.
Work with it: Excel workbook · CSV. Google Sheet that stays up to date: paste =IMPORTDATA("https://tickdelta.com/company/VMI/export.csv") into a cell.