Western Digital WDC
Western Digital was founded in 1970 and is a Standard & Poor’s 500 (“S&P 500”) company headquartered in San Jose, California. 10-K, Item 1
- Employees
- 40,000
- Headquarters
- San Jose, CA
- CEO
- Irving Tan
- Next results
- around Jan 28, 2027
Where each dollar of revenue went, FY2025
Revenue of $9.5B through the costs to a net profit of $1.9B · income statement of the 10-K
WDC among Technology peers
Six ratios from the latest 10-K. Each corner is the share of 74 peers the company is above, not a score.
What changed
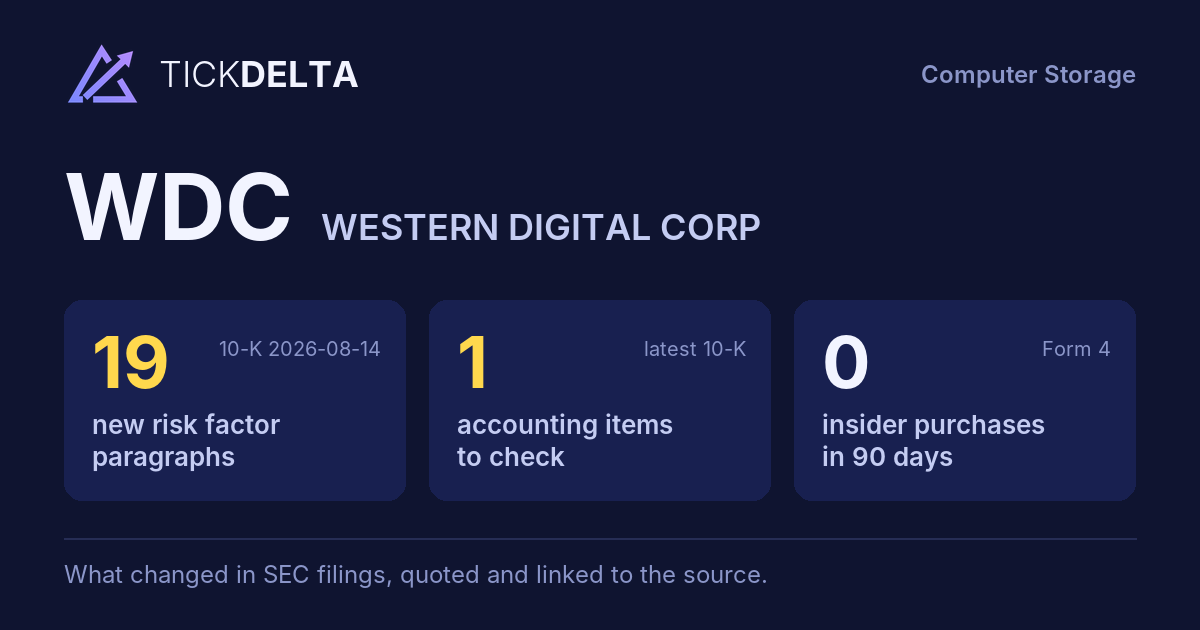
19 new risk paragraphs and 1 accounting fact worth reading about. 10-K filed Aug 14, 2026 against Aug 14, 2025.
Each row opens the detail with the quote and the filing. A row is a change worth reading, not a verdict.
Accounting checks
11 checks on the latest 10-K. Checks, not verdicts.
1fact worth reading about the other 10 checks found nothing to note
-
Cash from operations lower than net incomeCash from operations $3.9B vs net income $9.4B (FY ending Jul 3, 2026)
-
Receivables +36.3% vs revenue +35.7% (+0.6 pts)
9 more checks with nothing to note
-
Inventory +17.0% vs revenue +35.7% (-18.7 pts)
-
Same auditor in both 10-Ks: KPMG LLP
-
No statement of substantial doubt about going concern
-
No 8-K item 4.02 in the last 2 years
-
No NT 10-K or NT 10-Q in the last 2 years
-
The same matters as last year: Evaluation of sufficiency of audit evidence over certain variable consideration reductions to revenue; Tax-free determination of the Flash business separation and debt-for-equity and equity-for-equity exchanges
-
No sentence in the 10-K concludes that controls were not effective because of a material weakness
-
No 8-K item 2.06 in the last 2 years
-
No 8-K item 1.03 in the last 2 years
In their words
19 paragraphs in Risk Factors that were not in the 10-K filed Aug 14, 2025. Quoted as filed.
-
Item 1A · new paragraph · not in the 10-K filed Aug 14, 2025 10-K, ITEM 1A
Additionally, new technologies could impact demand for our products in unforeseen or unexpected ways. For example, if a shift away from Cloud and toward on-premises hardware diminishes the need for large-scale data center infrastructure, demand
-
Item 1A · new paragraph · not in the 10-K filed Aug 14, 2025 10-K, ITEM 1A
Long-term agreements expose us to certain execution, financial, and market risks, which could be significant. We have entered into long-term agreements with certain customers that commit us to deliver and our customers to purchase substantial volumes of products over multi-quarter or multi-year periods. These agreements also generally…
-
Item 1A · new paragraph · not in the 10-K filed Aug 14, 2025 10-K, ITEM 1A
In addition, armed conflicts and heightened geopolitical tensions can result in sanctions, export controls, tariffs and other trade restrictions, limit or restrict our ability to access certain markets and disrupt critical logistics networks, including air and ocean freight routes. For example, the escalation of the conflict involving…
-
Item 1A · new paragraph · not in the 10-K filed Aug 14, 2025 10-K, ITEM 1A
We may be adversely affected by the risks, challenges, and evolving regulatory landscape associated with the use of AI in our operations, product development, and business practices. We are increasingly leveraging AI technologies, including generative AI applications and tools, to support and enhance our various operational processes.…
New risk paragraphs, against peers
Latest 10-K of each, Technology companies closest in revenue
Paragraphs in Risk Factors with nothing like them in the company's 10-K the year before. A count of text, not of risk.
Financial performance
Last 4 fiscal years · 10-K XBRL
| Metric | FY2023 | FY2024 | FY2025 | FY2026 |
|---|---|---|---|---|
| Revenue | $6.3B | $6.3B | $9.5B | $12.9B |
| Net income | −$1.7B | −$798.0M | $1.9B | $9.4B |
| Operating cash flow | −$408.0M | −$294.0M | $1.7B | $3.9B |
| Free cash flow | −$1.2B | −$781.0M | $1.3B | $3.5B |
Revenue, FY2017 to FY2026
Ten fiscal years, each from its own 10-K · XBRL · USD
$12.9B ▲ 35.7% in FY2026$9.4B ▲ 398.9% in FY2026$3.5B ▲ 174.5% in FY2026
Recent filings
2 filings in the last 30 days · SEC EDGAR
-
10-QOct 23, 2026Quarterly report (10-Q) period ended Oct 2, 2026
-
8-KOct 22, 2026Quarterly results 8-K item 2.02
About the company
Western Digital, San Jose, CA · from the 10-K filed Aug 14, 2026
Western Digital was founded in 1970 and is a Standard & Poor’s 500 (“S&P 500”) company headquartered in San Jose, California. We are a leading developer, manufacturer, and provider of data storage devices and solutions based on hard disk drive (“HDD”) technology. HDDs are critical components in the worldwide data infrastructure market, powering the AI-driven digital economy. HDDs provide reliable, cost-effective, high-capacity storage needs for a wide range of applications, ranging from cloud data centers, enterprise storage systems, edge computing, and smart video to client and consumer devices.
- Headquarters
- San Jose, CA
- Country
- United States
- Reports in
- USD
- Listed on
- Nasdaq
- Fiscal year ends
- July 3
- Last results
- Oct 22, 2026
- Incorporated in
- DE
Employees, at the top of the page: "At the end of 2026, we employed approximately 40,000 people worldwide" (10-K). Address and exchange: SEC's company file.
Email alerts
Sources
The 10-K filed Aug 14, 2026 (open at SEC), compared with the 10-K filed Aug 14, 2025. Numbers from the XBRL of the 10-Ks; filings from SEC EDGAR.
Work with it: Excel workbook · CSV. Google Sheet that stays up to date: paste =IMPORTDATA("https://tickdelta.com/company/WDC/export.csv") into a cell.