J&J Snack Foods Corp JJSF
J & J Snack Foods Corp. (the “Company” or “J & J”) manufactures snack foods and distributes frozen beverages which it markets nationally to the foodservice and retail supermarket industries. 10-K, Item 1
- Headquarters
- Mount Laurel, NJ
- Next results
- around Nov 16, 2026
Where each dollar of revenue went, FY2025
Revenue of $1.6B through the costs to a net profit of $65.6M · income statement of the 10-K
JJSF among Consumer staples peers
Six ratios from the latest 10-K. Each corner is the share of 63 peers the company is above, not a score.
What changed
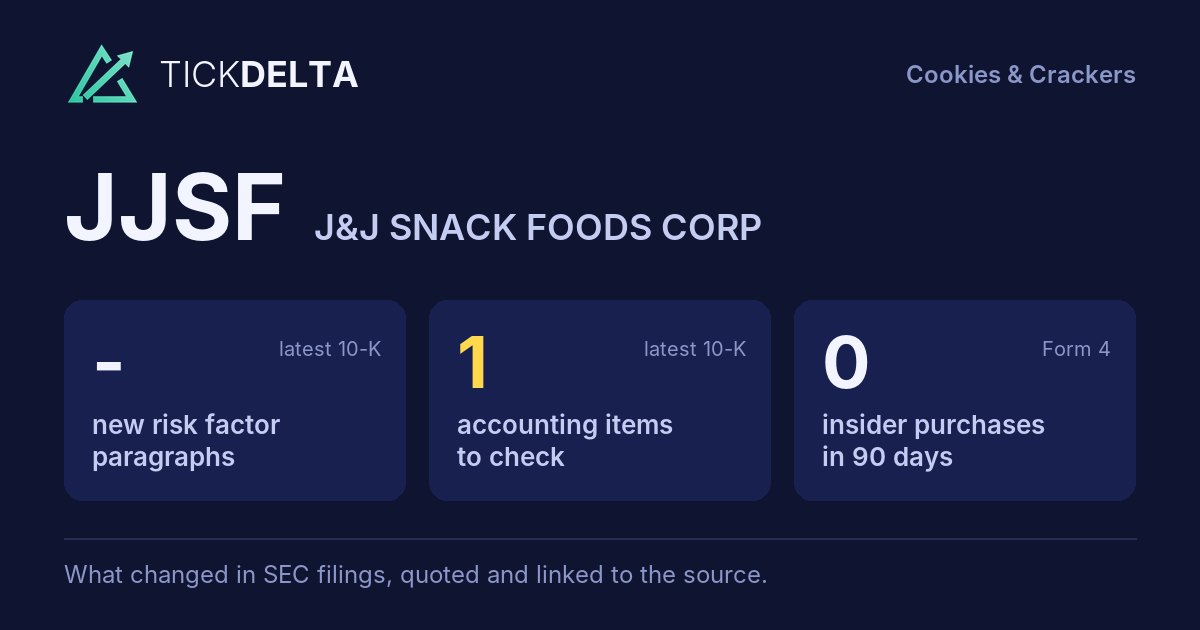
1 accounting fact worth reading about.
Each row opens the detail with the quote and the filing. A row is a change worth reading, not a verdict.
Accounting checks
10 checks on the latest 10-K. Checks, not verdicts.
1fact worth reading about the other 9 checks found nothing to note
-
Material impairment (8-K item 2.06)8-K item 2.06 (material impairments) filed Aug 28, 2025
-
Receivables -2.7% ($189.2M to $184.1M) vs revenue +0.5% ($1.6B to $1.6B), -3.3 pts apart
8 more checks with nothing to note
-
Cash from operations $165.1M vs net income $65.6M (FY ending Sep 27, 2025)
-
Inventory +1.2% ($173.1M to $175.2M) vs revenue +0.5% ($1.6B to $1.6B), +0.6 pts apart
-
Same auditor in both 10-Ks: GRANT THORNTON LLP
-
No statement of substantial doubt about going concern
-
No 8-K item 4.02 in the last 2 years
-
No NT 10-K or NT 10-Q in the last 2 years
-
No sentence in the 10-K concludes that controls were not effective because of a material weakness
-
No 8-K item 1.03 in the last 2 years
In their words
No new paragraphs in Risk Factors
No new paragraphs in Risk Factors, or fewer than two 10-Ks to compare.
Financial performance
Last 4 fiscal years · 10-K XBRL
| Metric | FY2022 | FY2023 | FY2024 | FY2025 |
|---|---|---|---|---|
| Revenue | $1.4B | $1.6B | $1.6B | $1.6B |
| Net income | $47.2M | $78.9M | $86.6M | $65.6M |
| Operating cash flow | $26.1M | $172.3M | $173.1M | $165.1M |
| Free cash flow | −$61.2M | $67.5M | $99.5M | $82.3M |
Revenue, FY2016 to FY2025
Ten fiscal years, each from its own 10-K · XBRL · USD
$1.6B ▲ 0.5% in FY2025$65.6M ▼ 24.2% in FY2025$82.3M ▼ 17.3% in FY2025
Recent filings
No new filings in the last 30 days · SEC EDGAR
Nothing new. The most recent filings:
-
10-QAug 6, 2026Quarterly report (10-Q) period ended Jun 27, 2026
-
8-KAug 5, 2026Quarterly results 8-K item 2.02
-
8-KJun 10, 2026Material agreement signed, New debt or obligation, Director or officer change 8-K items 1.01, 2.03, 5.02
-
10-QMay 7, 2026Quarterly report (10-Q) period ended Mar 28, 2026
About the company
J&J Snack Foods Corp, Mount Laurel, NJ · from the 10-K filed Nov 26, 2025
J & J Snack Foods Corp. (the “Company” or “J & J”) manufactures snack foods and distributes frozen beverages which it markets nationally to the foodservice and retail supermarket industries. The Company’s principal snack food products are soft pretzels marketed primarily under the brand names SUPERPRETZEL, BRAUHAUS, FEDERAL PRETZEL, and BAVARIAN BAKERY, frozen novelties marketed primarily under the DIPPIN’ DOTS, LUIGI’S, WHOLE FRUIT, ICEE, DOGSTERS, PHILLY SWIRL and MINUTE MAID* brand names, churros marketed primarily under the ¡HOLA! brand name, and bakery products sold primarily under the READI-BAKE, COUNTRY HOME, MARY B’S, DADDY RAY’S and HILL & VALLEY brand names as well as for private l…
- Headquarters
- Mount Laurel, NJ
- Country
- United States
- Reports in
- USD
- Listed on
- Nasdaq
- Fiscal year ends
- September 26
- Last results
- Aug 5, 2026
- Incorporated in
- NJ
Email alerts
Sources
Numbers from the XBRL of the 10-Ks; filings from SEC EDGAR.
Work with it: Excel workbook · CSV. Google Sheet that stays up to date: paste =IMPORTDATA("https://tickdelta.com/company/JJSF/export.csv") into a cell.