Equinix EQIX
Equinix (Nasdaq: EQIX) is the world's digital infrastructure company, shortening the path to boundless connectivity anywhere in the world to enable the innovations that enrich our work, life and planet. 10-K, Item 1
- Employees
- 13,716
- Headquarters
- Redwood City, CA
- CEO
- Adaire Fox-Martin
- Next results
- around Feb 10, 2027
Where each dollar of revenue went, FY2025
Revenue of $9.2B through the costs to a net profit of $1.4B · income statement of the 10-K
EQIX among Real estate peers
Six ratios from the latest 10-K. Each corner is the share of 28 peers the company is above, not a score.
What changed
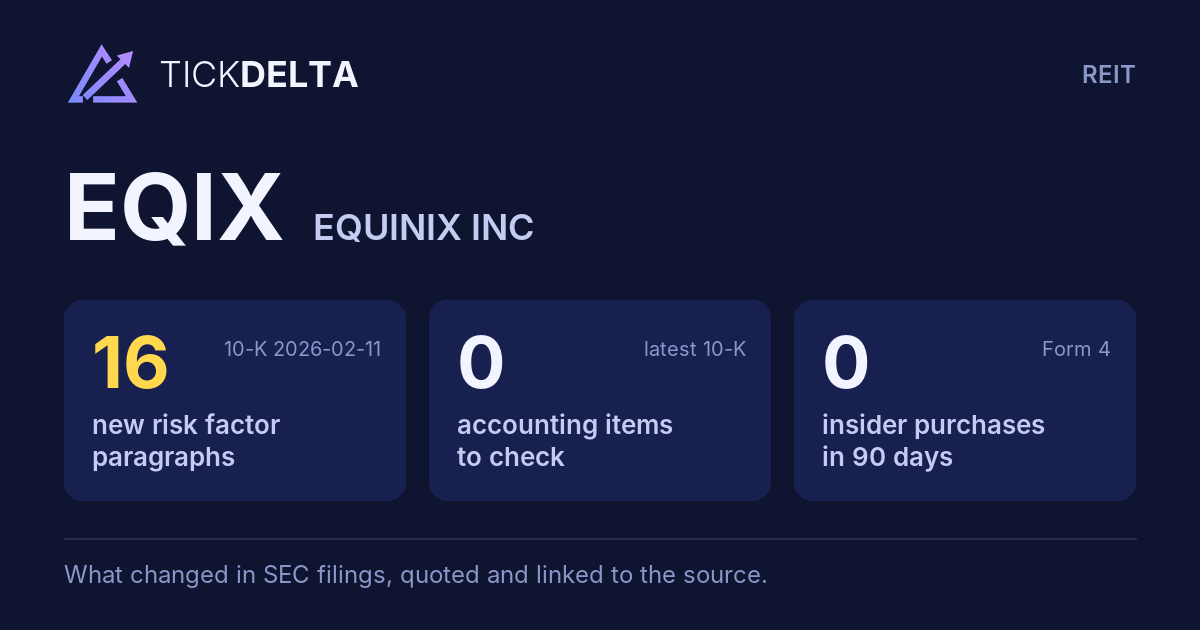
16 new risk paragraphs. 10-K filed Feb 11, 2026 against Feb 12, 2025.
Each row opens the detail with the quote and the filing. A row is a change worth reading, not a verdict.
Accounting checks
10 checks on the latest 10-K. Checks, not verdicts.
0facts worth reading about all 10 checks found nothing to note
-
Receivables +5.5% vs revenue +5.4% (+0.1 pts)
-
Cash from operations $3.9B vs net income $1.4B (FY ending Dec 31, 2025)
-
Same auditor in both 10-Ks: PricewaterhouseCoopers LLP
7 more checks with nothing to note
-
No statement of substantial doubt about going concern
-
No 8-K item 4.02 in the last 2 years
-
No NT 10-K or NT 10-Q in the last 2 years
-
The same matters as last year: Revenue Recognition - Colocation and Interconnection Revenues
-
No sentence in the 10-K concludes that controls were not effective because of a material weakness
-
No 8-K item 2.06 in the last 2 years
-
No 8-K item 1.03 in the last 2 years
In their words
16 paragraphs in Risk Factors that were not in the 10-K filed Feb 12, 2025. Quoted as filed.
-
Item 1A · new paragraph · not in the 10-K filed Feb 12, 2025 10-K, ITEM 1A
Geopolitical events and political tensions contribute to an already complex landscape, and could have a negative effect on our global business operations. Geopolitical events, including trade tensions between the U.S. and other countries, the war between Russia and Ukraine, and ongoing conflicts in the Middle East, could negatively…
-
Item 1A · new paragraph · not in the 10-K filed Feb 12, 2025 10-K, ITEM 1A
Further, because of the expected growth and opportunity related to AI, we anticipate significant investments in the data center industry by both current competitors and new investors and companies looking to capture this opportunity. If Equinix is unable to compete against these new market entrants, or capture a proportionate share of…
-
Item 1A · new paragraph · not in the 10-K filed Feb 12, 2025 10-K, ITEM 1A
Current relations between the U.S. and China have created increased supply chain risk due to successive U.S. legislation promoting decoupling from China on semiconductors and specific telecommunications equipment makers as well as the threat of increased tariffs and having to source from alternative suppliers for key components outside…
-
Item 1A · new paragraph · not in the 10-K filed Feb 12, 2025 10-K, ITEM 1A
We may not realize all of the anticipated benefits from our joint ventures. The success of these joint ventures will depend, in part, on the successful partnership between Equinix and our joint venture partners. Such a
New risk paragraphs, against peers
Latest 10-K of each, Real estate companies closest in revenue
Paragraphs in Risk Factors with nothing like them in the company's 10-K the year before. A count of text, not of risk.
From the same starting line, FY2016 to FY2025
Revenue, net income and free cash flow, each set to 100 in FY2016. What happened, from the 10-Ks. Not a forecast.
Financial performance
Last 4 fiscal years · 10-K XBRL
| Metric | FY2022 | FY2023 | FY2024 | FY2025 |
|---|---|---|---|---|
| Revenue | $7.3B | $8.2B | $8.7B | $9.2B |
| Net income | $705.0M | $969.0M | $815.0M | $1.4B |
| Operating cash flow | $3.0B | $3.2B | $3.2B | $3.9B |
| Free cash flow | $685.0M | $436.0M | $183.0M | −$400.0M |
Revenue, FY2016 to FY2025
Ten fiscal years, each from its own 10-K · XBRL · USD
$9.2B ▲ 5.4% in FY2025$1.4B ▲ 65.6% in FY2025−$400.0M in FY2025
Recent filings
5 filings in the last 30 days · SEC EDGAR
-
8-KNov 9, 2026Other events 8-K item 8.01
-
OfferingOct 28, 2026Shelf registration: shares and other securities, amount not fixed S-3ASR · Under this prospectus, we may from time to time offer and, if applicable, sell shares of our common stock having an aggregate offering price of up to $700,002,718, at prices and on terms to be determined by market conditions at the time of the offering.
-
OfferingOct 28, 2026Shelf registration: shares and other securities, amount not fixed S-3ASR · Ltd. Equinix, Inc. may offer from time to time common stock, preferred stock, debt securities, depositary shares representing preferred stock, warrants, purchase contracts, units or guarantees of debt securities, in one or more offerings, in amounts, at prices and on terms determined at the time of
-
8-KOct 28, 2026Quarterly results 8-K item 2.02
-
10-QOct 28, 2026Quarterly report (10-Q) period ended Sep 30, 2026
About the company
Equinix, Redwood City, CA · from the 10-K filed Feb 11, 2026
Equinix (Nasdaq: EQIX) is the world's digital infrastructure company, shortening the path to boundless connectivity anywhere in the world to enable the innovations that enrich our work, life and planet. Equinix combines a global footprint of International Business ExchangeTM (IBX®) and xScaleTM data centers in the Americas, Asia-Pacific, and Europe, the Middle East and Africa ("EMEA") regions, infrastructure and interconnection offerings, and digital ecosystems required to serve a large and diverse set of customers around the world.
- Headquarters
- Redwood City, CA
- Country
- United States
- Reports in
- USD
- Listed on
- Nasdaq
- Fiscal year ends
- December 31
- Last results
- Oct 28, 2026
- Incorporated in
- DE
Employees, at the top of the page: "As of December 31, 2025, we had 13,716 employees worldwide with 5,917 based in the Americas, 4,706 based in EMEA and 3,093 based in Asia-Pacific" (10-K). Address and exchange: SEC's company file.
Email alerts
Sources
The 10-K filed Feb 11, 2026 (open at SEC), compared with the 10-K filed Feb 12, 2025. Numbers from the XBRL of the 10-Ks; filings from SEC EDGAR.
Work with it: Excel workbook · CSV. Google Sheet that stays up to date: paste =IMPORTDATA("https://tickdelta.com/company/EQIX/export.csv") into a cell.