Palo Alto Networks PANW
Palo Alto Networks, Inc. is a global artificial intelligence (“AI”) cybersecurity provider and our vision is a world where each day is safer and more secure than the one before. 10-K, Item 1
- Headquarters
- Santa Clara, CA
- CEO
- Nikesh Arora
- Next results
- around Nov 18, 2026
Where each dollar of revenue went, FY2026
Revenue of $11.5B through the costs to a net profit of $307.0M · income statement of the 10-K
PANW among Technology peers
Six ratios from the latest 10-K. Each corner is the share of 74 peers the company is above, not a score.
What changed
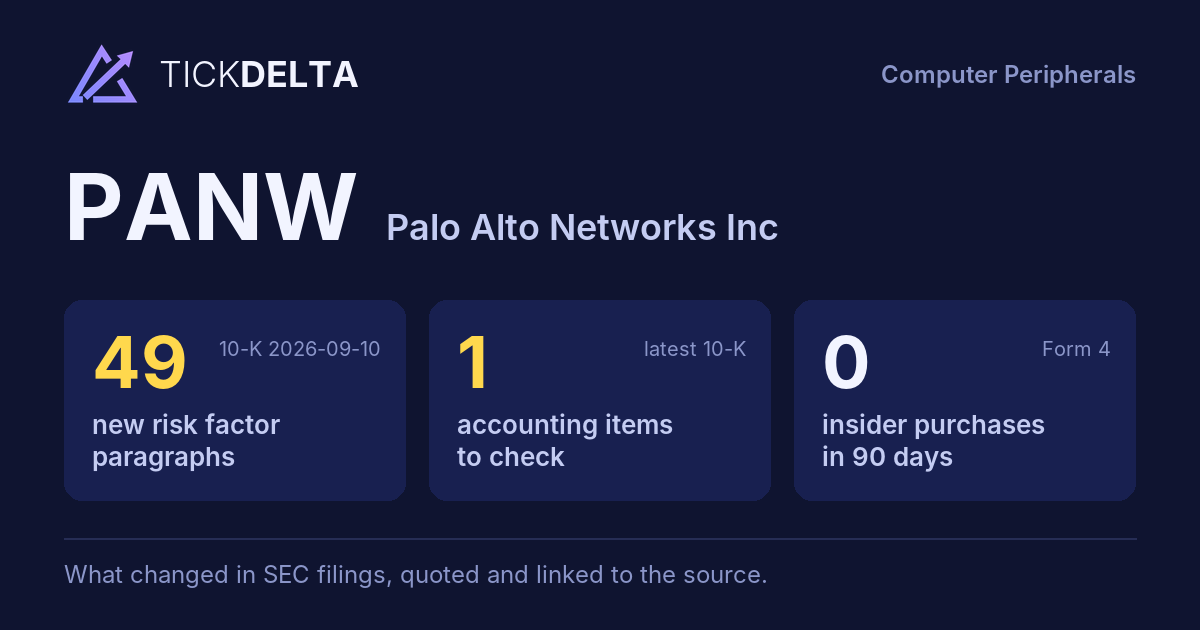
49 new risk paragraphs and 1 accounting fact worth reading about. 10-K filed Sep 10, 2026 against Aug 29, 2025.
Each row opens the detail with the quote and the filing. A row is a change worth reading, not a verdict.
Accounting checks
11 checks on the latest 10-K. Checks, not verdicts.
1fact worth reading about the other 10 checks found nothing to note
-
Critical audit matters changedNew this year: ACQUISITION OF CYBERARK SOFTWARE LTD. (“CYBERARK”) - VALUATION OF PLATFORM RENEWALS (“Description As disclosed in Notes 1 and 8 to the consolidated financial statements, on February 11, 2026, the Company completed the acquisition of CyberArk for total purchase consideration of $21.1 billion. The Company accounted for the acquisition as a business combination. In connection with this ”). No longer listed: VALUATION OF CONTINGENT CONSIDERATION LIABILITY IN CONNECTION WITH THE ACQUISITION OF IBM QRADAR ASSETS. Same as last year: REVENUE RECOGNITION
-
Receivables +22.4% vs revenue +24.5% (-2.1 pts)
9 more checks with nothing to note
-
Cash from operations $4.6B vs net income $307.0M (FY ending Jul 31, 2026)
-
Inventory +3.5% vs revenue +24.5% (-21.0 pts)
-
Same auditor in both 10-Ks: Ernst & Young LLP
-
No statement of substantial doubt about going concern
-
No 8-K item 4.02 in the last 2 years
-
No NT 10-K or NT 10-Q in the last 2 years
-
No sentence in the 10-K concludes that controls were not effective because of a material weakness
-
No 8-K item 2.06 in the last 2 years
-
No 8-K item 1.03 in the last 2 years
In their words
49 paragraphs in Risk Factors that were not in the 10-K filed Aug 29, 2025. Quoted as filed.
-
Item 1A · new paragraph · not in the 10-K filed Aug 29, 2025 10-K, ITEM 1A
Our consumption- or usage-based offerings may expose us to customer usage optimization behavior that could create revenue volatility. A growing portion of our revenue is generated from offerings priced on a consumption or usage basis, including certain of our observability and AI-related offerings. Pricing on this basis may result in…
-
Item 1A · new paragraph · not in the 10-K filed Aug 29, 2025 10-K, ITEM 1A
The “identity security” market lacks a universally accepted definition, which could lead to mischaracterization of our offerings and adverse evaluations by industry stakeholders. We have significantly expanded our participation in what is commonly referred to as the “identity security” market. However, this market lacks a standardized…
-
Item 1A · new paragraph · not in the 10-K filed Aug 29, 2025 10-K, ITEM 1A
The success of our strategy depends on maintaining a broad ecosystem of integrations with third-party technologies, which requires significant ongoing investment. The success of our strategy depends in part on the breadth and depth of our integrations with third-party technologies, including cloud infrastructure providers, identity…
-
Item 1A · new paragraph · not in the 10-K filed Aug 29, 2025 10-K, ITEM 1A
Vulnerabilities within our AI systems may be identified by researchers or malicious actors before we detect or remediate them, which could result in security incidents, data privacy issues, reputational damage, or loss of customer confidence. Advances in AI have also increased the speed, scale, and sophistication of cybersecurity threat…
New risk paragraphs, against peers
Latest 10-K of each, Technology companies closest in revenue
Paragraphs in Risk Factors with nothing like them in the company's 10-K the year before. A count of text, not of risk.
Financial performance
Last 4 fiscal years · 10-K XBRL
| Metric | FY2023 | FY2024 | FY2025 | FY2026 |
|---|---|---|---|---|
| Revenue | $6.9B | $8.0B | $9.2B | $11.5B |
| Net income | $439.7M | $2.6B | $1.1B | $307.0M |
| Operating cash flow | $2.8B | $3.3B | $3.7B | $4.6B |
| Free cash flow | $2.6B | $3.1B | $3.5B | $4.1B |
Revenue, FY2017 to FY2026
Ten fiscal years, each from its own 10-K · XBRL · USD
$11.5B ▲ 24.5% in FY2026$307.0M ▼ 72.9% in FY2026$4.1B ▲ 18.6% in FY2026
Recent filings
No new filings in the last 30 days · SEC EDGAR
Nothing new. The most recent filings:
-
10-KSep 10, 2026Annual report (10-K) period ended Jul 31, 2026
-
8-KSep 1, 2026Quarterly results 8-K item 2.02
-
8-KAug 21, 2026Director or officer change, Bylaws or fiscal year changed 8-K items 5.02, 5.03
-
10-QJun 3, 2026Quarterly report (10-Q) period ended Apr 30, 2026
About the company
Palo Alto Networks, Santa Clara, CA · from the 10-K filed Sep 10, 2026
Palo Alto Networks, Inc. is a global artificial intelligence (“AI”) cybersecurity provider and our vision is a world where each day is safer and more secure than the one before. We were incorporated in 2005 and are headquartered in Santa Clara, California. Our mission is to be the cybersecurity partner of choice, protecting our digital way of life. Our platforms and services help secure enterprise users, networks, clouds, endpoints, AI apps and agents, and identities by delivering comprehensive cybersecurity backed by AI and automation, and provide real-time visibility and monitoring across cloud infrastructure, applications and AI workloads.
- Headquarters
- Santa Clara, CA
- Country
- United States
- Reports in
- USD
- Listed on
- Nasdaq
- Fiscal year ends
- July 31
- Last results
- Sep 1, 2026
- Incorporated in
- DE
Email alerts
Sources
The 10-K filed Sep 10, 2026 (open at SEC), compared with the 10-K filed Aug 29, 2025. Numbers from the XBRL of the 10-Ks; filings from SEC EDGAR.
Work with it: Excel workbook · CSV. Google Sheet that stays up to date: paste =IMPORTDATA("https://tickdelta.com/company/PANW/export.csv") into a cell.