Verisk Analytics VRSK
Verisk is a leading data, analytics, and technology provider serving clients in the insurance ecosystem. 10-K, Item 1
- Employees
- 8,000
- Headquarters
- Jersey City, NJ
- CEO
- Lee Shavel
- Next results
- around Feb 17, 2027
Where each dollar of revenue went, FY2025
Revenue of $3.1B through the costs to a net profit of $908.3M · income statement of the 10-K
VRSK among Industrials peers
Six ratios from the latest 10-K. Each corner is the share of 81 peers the company is above, not a score.
What changed
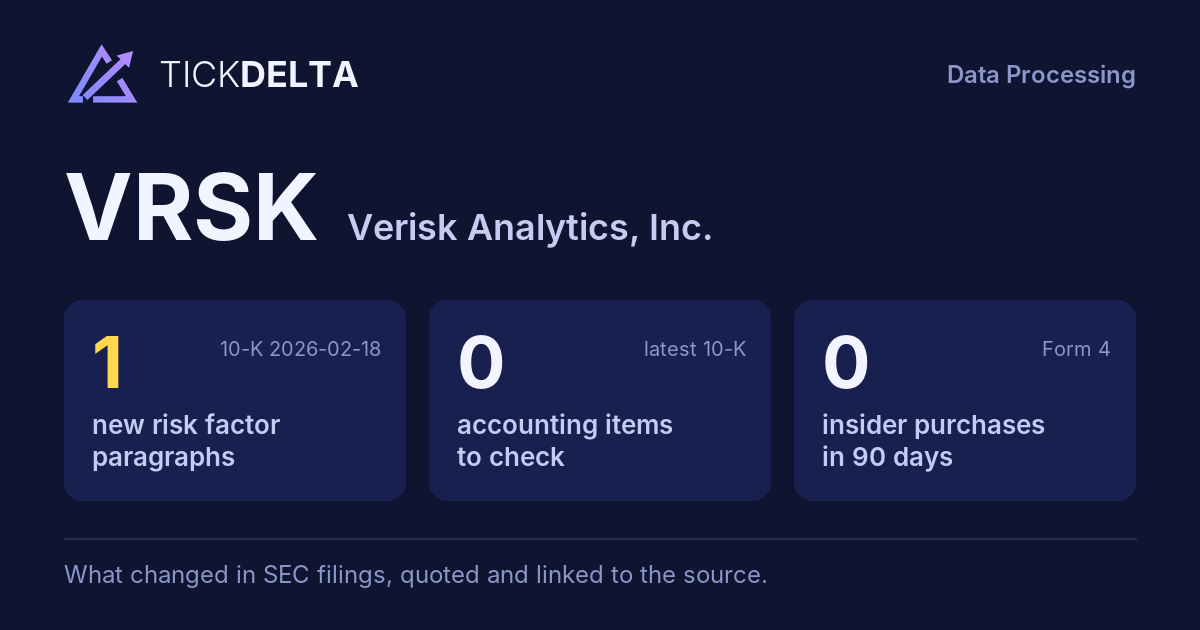
1 new risk paragraph. 10-K filed Feb 18, 2026 against Feb 26, 2025.
Each row opens the detail with the quote and the filing. A row is a change worth reading, not a verdict.
Accounting checks
10 checks on the latest 10-K. Checks, not verdicts.
0facts worth reading about all 10 checks found nothing to note
-
Receivables -2.8% vs revenue +6.6% (-9.4 pts)
-
Cash from operations $1.4B vs net income $908.3M (FY ending Dec 31, 2025)
-
Same auditor in both 10-Ks: Deloitte & Touche LLP
7 more checks with nothing to note
-
No statement of substantial doubt about going concern
-
No 8-K item 4.02 in the last 2 years
-
No NT 10-K or NT 10-Q in the last 2 years
-
The same matters as last year: Fixed Assets - Capitalization of Internal Software Development Costs
-
No sentence in the 10-K concludes that controls were not effective because of a material weakness
-
No 8-K item 2.06 in the last 2 years
-
No 8-K item 1.03 in the last 2 years
In their words
1 paragraph in Risk Factors that was not in the 10-K filed Feb 26, 2025. Quoted as filed.
-
Item 1A · new paragraph · not in the 10-K filed Feb 26, 2025 10-K, ITEM 1A
limit who may call special meetings of stockholders to holders of at least 25% of our common stock;
New risk paragraphs, against peers
Latest 10-K of each, Industrials companies closest in revenue
Paragraphs in Risk Factors with nothing like them in the company's 10-K the year before. A count of text, not of risk.
Financial performance
Last 4 fiscal years · 10-K XBRL
| Metric | FY2022 | FY2023 | FY2024 | FY2025 |
|---|---|---|---|---|
| Revenue | $2.5B | $2.7B | $2.9B | $3.1B |
| Net income | $953.9M | $614.6M | $958.2M | $908.3M |
| Operating cash flow | $1.1B | $1.1B | $1.1B | $1.4B |
| Free cash flow | $784.3M | $830.7M | $920.1M | $1.2B |
Revenue, FY2016 to FY2025
Ten fiscal years, each from its own 10-K · XBRL · USD
$3.1B ▲ 6.6% in FY2025$908.3M ▼ 5.2% in FY2025$1.2B ▲ 29.5% in FY2025
Recent filings
3 filings in the last 30 days · SEC EDGAR
-
8-KNov 5, 2026Quarterly results 8-K item 2.02
-
10-QNov 5, 2026Quarterly report (10-Q) period ended Sep 30, 2026
-
8-KOct 29, 2026Other events 8-K item 8.01
About the company
Verisk Analytics, Jersey City, NJ · from the 10-K filed Feb 18, 2026
Verisk is a leading data, analytics, and technology provider serving clients in the insurance ecosystem. Using advanced technologies to collect and analyze billions of records, we draw on unique data assets, insurance industry knowledge, and technological expertise to provide valuable solutions that are integrated into client workflows. We offer predictive analytics and decision support solutions to clients in rating, underwriting, claims, catastrophe, weather risk, and many other fields. In the United States (“U.S.”) and around the world, we help clients protect individuals, communities, and businesses. We completed the sale of our Energy business on February 1, 2023.
- Headquarters
- Jersey City, NJ
- Country
- United States
- Reports in
- USD
- Listed on
- Nasdaq
- Fiscal year ends
- December 31
- Last results
- Nov 5, 2026
- Incorporated in
- DE
Employees, at the top of the page: "As a knowledge-based business, we carefully integrate the skills and talents of approximately 8,000 employees worldwide as of December 31, 2025" (10-K). Address and exchange: SEC's company file.
Email alerts
Sources
The 10-K filed Feb 18, 2026 (open at SEC), compared with the 10-K filed Feb 26, 2025. Numbers from the XBRL of the 10-Ks; filings from SEC EDGAR.
Work with it: Excel workbook · CSV. Google Sheet that stays up to date: paste =IMPORTDATA("https://tickdelta.com/company/VRSK/export.csv") into a cell.