Performance Food Group Co PFGC
- Employees
- 44,000
- Headquarters
- Richmond, VA
- CEO
- Scott E. McPherson
- Next results
- around Feb 3, 2027
Where each dollar of revenue went, FY2026
Revenue of $67.8B through the costs to a net profit of $359.3M · income statement of the 10-K
PFGC among Consumer staples peers
Six ratios from the latest 10-K. Each corner is the share of 63 peers the company is above, not a score.
What changed
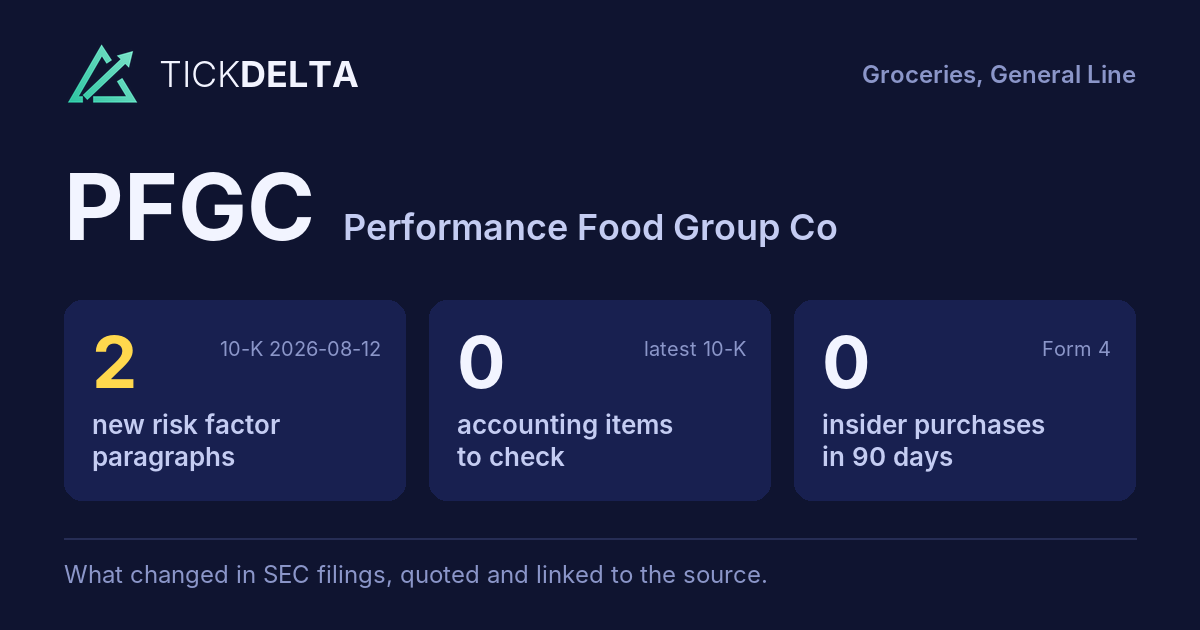
2 new risk paragraphs. 10-K filed Aug 12, 2026 against Aug 13, 2025.
Each row opens the detail with the quote and the filing. A row is a change worth reading, not a verdict.
Accounting checks
11 checks on the latest 10-K. Checks, not verdicts.
0facts worth reading about all 11 checks found nothing to note
-
Receivables +7.8% ($2.8B to $3.1B) vs revenue +7.2% ($63.3B to $67.8B), +0.6 pts apart
-
Cash from operations $1.4B vs net income $359.3M (FY ending Jun 27, 2026)
-
Inventory +11.5% ($3.9B to $4.3B) vs revenue +7.2% ($63.3B to $67.8B), +4.3 pts apart
8 more checks with nothing to note
-
Same auditor in both 10-Ks: DELOITTE & TOUCHE LLP
-
No statement of substantial doubt about going concern
-
No 8-K item 4.02 in the last 2 years
-
No NT 10-K or NT 10-Q in the last 2 years
-
The same matters as last year: Vendor Rebates and Promotional Incentives
-
No sentence in the 10-K concludes that controls were not effective because of a material weakness
-
No 8-K item 2.06 in the last 2 years
-
No 8-K item 1.03 in the last 2 years
In their words
2 paragraphs in Risk Factors that were not in the 10-K filed Aug 13, 2025. Quoted as filed.
-
Item 1A · new paragraph · not in the 10-K filed Aug 13, 2025 10-K, ITEM 1A
currently extended for the remittance of taxes that we collect on their behalf. If these excise taxes are substantially increased, or credit terms are substantially reduced, it could have a material adverse effect on our business, financial condition, and results of operations.
-
Item 1A · new paragraph · not in the 10-K filed Aug 13, 2025 10-K, ITEM 1A
payments on our indebtedness would result in an event of default under the agreement governing such indebtedness, which may result in the acceleration of some or all of our outstanding indebtedness.
New risk paragraphs, against peers
Latest 10-K of each, Consumer staples companies closest in revenue
Paragraphs in Risk Factors with nothing like them in the company's 10-K the year before. A count of text, not of risk.
Financial performance
Last 4 fiscal years · 10-K XBRL
| Metric | FY2023 | FY2024 | FY2025 | FY2026 |
|---|---|---|---|---|
| Revenue | $57.3B | $58.3B | $63.3B | $67.8B |
| Net income | $397.2M | $435.9M | $340.2M | $359.3M |
| Operating cash flow | $832.1M | $1.2B | $1.2B | $1.4B |
| Free cash flow | $562.4M | $767.4M | $704.1M | $1.0B |
Revenue, FY2017 to FY2026
Ten fiscal years, each from its own 10-K · XBRL · USD
$67.8B ▲ 7.2% in FY2026$359.3M ▲ 5.6% in FY2026$1.0B ▲ 46.2% in FY2026
Recent filings
4 filings in the last 30 days · SEC EDGAR
-
Planned saleNov 4, 2026H. Patrick Hatcher (Executive Vice President & Chief Financial Officer) adopted a 10b5-1 trading plan reported in the 10-Q, up to 10,230 shares, runs to Apr 30, 2027
-
8-KNov 4, 2026Quarterly results 8-K item 2.02
-
10-QNov 4, 2026Quarterly report (10-Q) period ended Sep 26, 2026
-
Planned saleNov 3, 2026Sachem Head Capital Management LP (Affiliate of Former Director) gave notice of a planned sale of 1,500,000 shares worth about $151.3M Form 144, approximate sale date Nov 3, 2026
About the company
Performance Food Group Co, Richmond, VA · from the 10-K filed Aug 12, 2026
Performance Food Group Company, through its subsidiaries, markets and distributes more than 300,000 food and food-related products to customers across North America, from our over 150 distribution centers to over 350,000 customer locations in the food-away-from-home industry. Our over 44,000 employees serve a diverse mix of customers, from independent and chain restaurants to schools, business and industry locations, vending distributors, office coffee service distributors, retailers, convenience stores, and theaters. We source our products from various suppliers and serve as an important partner to our suppliers by providing them access to our broad customer base.
- Headquarters
- Richmond, VA
- Country
- United States
- Reports in
- USD
- Listed on
- NYSE
- Fiscal year ends
- July 3
- Last results
- Nov 4, 2026
- Incorporated in
- DE
Employees, at the top of the page: "As of June 27, 2026, we had over 44,000 employees of whom approximately 2,800 were members of local unions associated with the International Brotherhood of Teamsters or other unions" (10-K). Address and exchange: SEC's company file.
Email alerts
Sources
The 10-K filed Aug 12, 2026 (open at SEC), compared with the 10-K filed Aug 13, 2025. Numbers from the XBRL of the 10-Ks; filings from SEC EDGAR.
Work with it: Excel workbook · CSV. Google Sheet that stays up to date: paste =IMPORTDATA("https://tickdelta.com/company/PFGC/export.csv") into a cell.