Gates Industrial Corp Ltd. GTES
We are a global manufacturer of innovative, highly engineered power transmission and fluid power solutions. 10-K, Item 1
- Headquarters
- Denver, CO
- Next results
- around Feb 11, 2027
Where each dollar of revenue went, FY2025
Revenue of $3.4B through the costs to a net profit of $251.4M · income statement of the 10-K
GTES among Industrials peers
Six ratios from the latest 10-K. Each corner is the share of 251 peers the company is above, not a score.
What changed
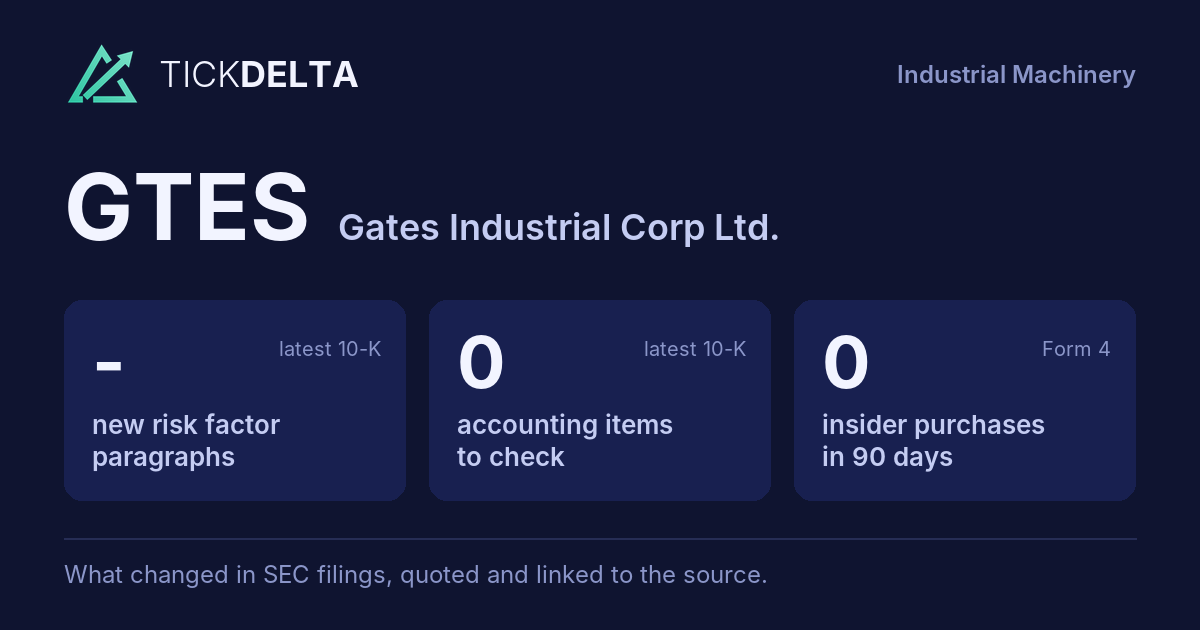
Nothing new in the latest 10-K.
Each row opens the detail with the quote and the filing. A row is a change worth reading, not a verdict.
Accounting checks
11 checks on the latest 10-K. Checks, not verdicts.
0facts worth reading about all 11 checks found nothing to note
-
Receivables +3.0% ($722.7M to $744.2M) vs revenue +1.0% ($3.4B to $3.4B), +1.9 pts apart
-
Cash from operations $478.1M vs net income $251.4M (FY ending Dec 31, 2025)
-
Inventory +3.6% ($676.0M to $700.0M) vs revenue +1.0% ($3.4B to $3.4B), +2.5 pts apart
8 more checks with nothing to note
-
Same auditor in both 10-Ks: Deloitte & Touche LLP
-
No statement of substantial doubt about going concern
-
No 8-K item 4.02 in the last 2 years
-
No NT 10-K or NT 10-Q in the last 2 years
-
The same matters as last year: Impairment of Goodwill and Indefinite-Lived Intangible Assets
-
No sentence in the 10-K concludes that controls were not effective because of a material weakness
-
No 8-K item 2.06 in the last 2 years
-
No 8-K item 1.03 in the last 2 years
In their words
No new paragraphs in Risk Factors
No new paragraphs in Risk Factors, or fewer than two 10-Ks to compare.
Financial performance
Last 4 fiscal years · 10-K XBRL
| Metric | FY2022 | FY2023 | FY2024 | FY2025 |
|---|---|---|---|---|
| Revenue | $3.6B | $3.6B | $3.4B | $3.4B |
| Net income | $220.8M | $232.9M | $194.9M | $251.4M |
| Operating cash flow | $265.8M | $481.0M | $379.6M | $478.1M |
| Free cash flow | $188.2M | $419.8M | $296.5M | $404.9M |
Revenue, FY2016 to FY2025
Ten fiscal years, each from its own 10-K · XBRL · USD
$3.4B ▲ 1.0% in FY2025$251.4M ▲ 29.0% in FY2025$404.9M ▲ 36.6% in FY2025
Recent filings
2 filings in the last 30 days · SEC EDGAR
-
8-KOct 30, 2026Quarterly results 8-K item 2.02
-
10-QOct 30, 2026Quarterly report (10-Q) period ended Sep 26, 2026
About the company
Gates Industrial Corp Ltd., Denver, CO · from the 10-K filed Feb 12, 2026
We are a global manufacturer of innovative, highly engineered power transmission and fluid power solutions. We offer a broad portfolio of products to diverse aftermarket channel customers, and to original equipment manufacturers (“OEM”) as specified components, with the majority of our revenue coming from aftermarket channels. Our products are used in applications across numerous end markets, including automotive aftermarket, automotive OEM, diversified industrial, industrial off-highway, industrial on-highway, energy and resources, and personal mobility.
- Headquarters
- Denver, CO
- Country
- United States
- Reports in
- USD
- Listed on
- NYSE
- Fiscal year ends
- December 31
- Last results
- Oct 30, 2026
- Incorporated in
- Bermuda
Email alerts
Sources
Numbers from the XBRL of the 10-Ks; filings from SEC EDGAR.
Work with it: Excel workbook · CSV. Google Sheet that stays up to date: paste =IMPORTDATA("https://tickdelta.com/company/GTES/export.csv") into a cell.