Broadcom AVGO
We are a global technology leader that designs, develops and supplies a broad range of semiconductor and semiconductor-based solutions and infrastructure software solutions. 10-K, Item 1
- Employees
- 33,000
- Headquarters
- Palo Alto, CA
- CEO
- Hock E. Tan
- Next results
- around Dec 10, 2026
Where each dollar of revenue went, FY2025
Revenue of $63.9B through the costs to a net profit of $23.1B · income statement of the 10-K
AVGO among Technology peers
Six ratios from the latest 10-K. Each corner is the share of 74 peers the company is above, not a score.
What changed
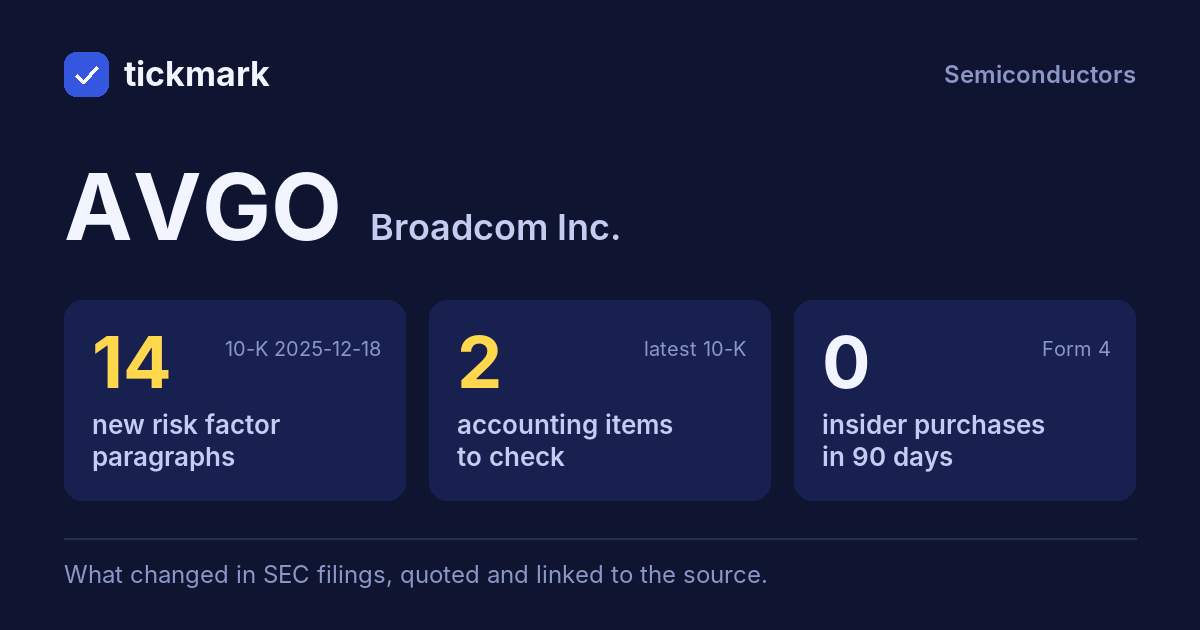
14 new risk paragraphs and 2 accounting facts worth reading about. 10-K filed Dec 18, 2025 against Dec 20, 2024.
Each row opens the detail with the quote and the filing. A row is a change worth reading, not a verdict.
Accounting checks
11 checks on the latest 10-K. Checks, not verdicts.
2facts worth reading about the other 9 checks found nothing to note
-
Receivables growing faster than revenueReceivables +61.8% vs revenue +23.9% (+37.9 pts)
-
Critical audit matters changedNew this year: Revenue Recognition - Certain Software and Support Revenue in the Infrastructure Software Segment (“As disclosed in Note 13 to the consolidated financial statements, the Company’s net revenue for the infrastructure software segment for the year ended November 2, 2025 was $27,029 million, a significant portion of which related to certain software and support revenue. As disclosed in Note 2, revenue”)
-
Cash from operations $27.5B vs net income $23.1B (FY ending Nov 2, 2025)
8 more checks with nothing to note
-
Inventory +29.0% vs revenue +23.9% (+5.1 pts)
-
Same auditor in both 10-Ks: PricewaterhouseCoopers LLP
-
No statement of substantial doubt about going concern
-
No 8-K item 4.02 in the last 2 years
-
No NT 10-K or NT 10-Q in the last 2 years
-
No sentence in the 10-K concludes that controls were not effective because of a material weakness
-
No 8-K item 2.06 in the last 2 years
-
No 8-K item 1.03 in the last 2 years
In their words
14 paragraphs in Risk Factors that were not in the 10-K filed Dec 20, 2024. Quoted as filed.
-
Item 1A · new paragraph · not in the 10-K filed Dec 20, 2024 10-K, ITEM 1A
While U.S. tariffs and counter-tariffs, including semiconductor-related tariffs, have not had a material impact on our financial condition or results of operations, tariffs and other macroeconomic factors could materially increase costs and disrupt our supply chain. We continuously manage product availability and costs in our supply…
-
Item 1A · new paragraph · not in the 10-K filed Dec 20, 2024 10-K, ITEM 1A
We operate in a highly cyclical semiconductor industry that is undergoing profound change due to AI. The semiconductor industry is highly cyclical and is subject to rapid price erosion, wide fluctuations in product supply and demand, constant and rapid technological change, evolving technical standards and evolving product applications.…
-
Item 1A · new paragraph · not in the 10-K filed Dec 20, 2024 10-K, ITEM 1A
The timing of design wins is unpredictable and implementing production for a major design win or multiple design wins at the same time, such as our design wins for our custom AI accelerators or XPUs, network switches and other AI-related products, may strain our resources and those of our CMs. Some of our customers who have selected us…
-
Item 1A · new paragraph · not in the 10-K filed Dec 20, 2024 10-K, ITEM 1A
Our business depends on a wide variety of complex IT systems and services, including cloud-based and other critical corporate services relating to, among other things, product research and development, financial reporting, product orders
New risk paragraphs, against peers
Latest 10-K of each, Technology companies closest in revenue
Paragraphs in Risk Factors with nothing like them in the company's 10-K the year before. A count of text, not of risk.
Financial performance
Last 4 fiscal years · 10-K XBRL
| Metric | FY2022 | FY2023 | FY2024 | FY2025 |
|---|---|---|---|---|
| Revenue | $33.2B | $35.8B | $51.6B | $63.9B |
| Net income | $11.5B | $14.1B | $5.9B | $23.1B |
| Operating cash flow | $16.7B | $18.1B | $20.0B | $27.5B |
| Free cash flow | $16.3B | $17.6B | $19.4B | $26.9B |
Revenue, FY2016 to FY2025
Ten fiscal years, each from its own 10-K · XBRL · USD
$63.9B ▲ 23.9% in FY2025$23.1B ▲ 292.3% in FY2025$26.9B ▲ 38.6% in FY2025
Recent filings
1 filing in the last 30 days · SEC EDGAR
-
8-KOct 27, 2026New debt or obligation 8-K item 2.03
About the company
Broadcom, Palo Alto, CA · from the 10-K filed Dec 18, 2025
We are a global technology leader that designs, develops and supplies a broad range of semiconductor and semiconductor-based solutions and infrastructure software solutions. Our more than 60-year history of innovation dates back to our diverse origins from AT&T/Bell Labs, Lucent and Hewlett-Packard Company, and has evolved through acquisitions, including LSI Corporation, Broadcom Corporation, Brocade Communications Systems, Inc., CA, Inc., Symantec Enterprise Security, and VMware, Inc. (“VMware”). Over the years, we have assembled a large team of semiconductor and software design engineers around the world.
- Headquarters
- Palo Alto, CA
- Country
- United States
- Listed on
- Nasdaq
- Fiscal year ends
- November 1
- Last results
- Sep 2, 2026
Employees, at the top of the page: "As of November 2, 2025, we had approximately 33,000 employees worldwide, with approximately 57% in research and development roles" (10-K). Address and exchange: SEC's company file.
Email alerts
Sources
The 10-K filed Dec 18, 2025 (open at SEC), compared with the 10-K filed Dec 20, 2024. Numbers from the XBRL of the 10-Ks; filings from SEC EDGAR.
Work with it: Excel workbook · CSV. Google Sheet that stays up to date: paste =IMPORTDATA("https://tickdelta.com/company/AVGO/export.csv") into a cell.