TransMedics Group, Inc. TMDX
We are a medical technology company transforming organ transplant therapy for end-stage organ failure patients across multiple disease states. 10-K, Item 1
- Headquarters
- Andover, MA
- CEO
- Waleed H. Hassanein
- Next results
- around Feb 23, 2027
Where each dollar of revenue went, FY2025
Revenue of $605.5M through the costs to a net profit of $190.3M · income statement of the 10-K
TMDX among Health care peers
Six ratios from the latest 10-K. Each corner is the share of 154 peers the company is above, not a score.
What changed
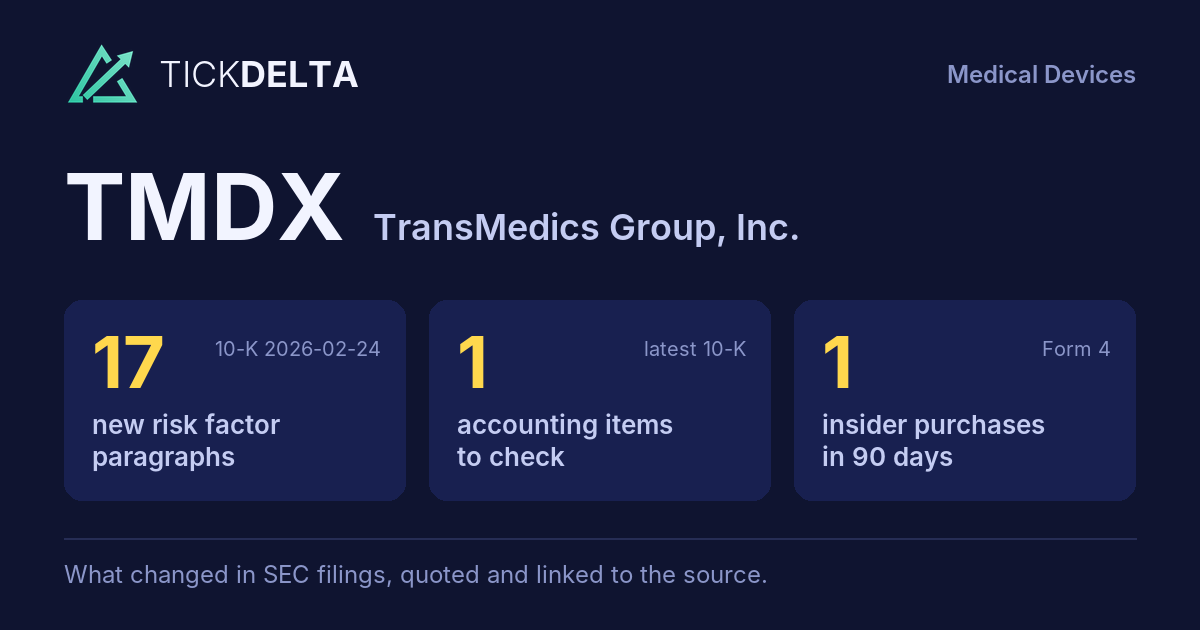
17 new risk paragraphs and 1 accounting fact worth reading about. 10-K filed Feb 24, 2026 against Feb 27, 2025.
Each row opens the detail with the quote and the filing. A row is a change worth reading, not a verdict.
Accounting checks
11 checks on the latest 10-K. Checks, not verdicts.
1fact worth reading about the other 10 checks found nothing to note
-
Material weakness in internal control“Based on the evaluation of our disclosure controls and procedures as of December 31, 2025, our President and Chief Executive Officer and our Chief Financial Officer concluded that, as of such date, our disclosure controls and procedures were not effective due to the material weakness in internal control over financial reporting described below.”
-
Receivables -13.8% ($97.7M to $84.3M) vs revenue +37.1% ($441.5M to $605.5M), -50.9 pts apart
9 more checks with nothing to note
-
Cash from operations $192.8M vs net income $190.3M (FY ending Dec 31, 2025)
-
Inventory +5.0% ($46.6M to $48.9M) vs revenue +37.1% ($441.5M to $605.5M), -32.1 pts apart
-
Same auditor in both 10-Ks: PricewaterhouseCoopers LLP
-
No statement of substantial doubt about going concern
-
No 8-K item 4.02 in the last 2 years
-
No NT 10-K or NT 10-Q in the last 2 years
-
The same matters as last year: Revenue Recognition
-
No 8-K item 2.06 in the last 2 years
-
No 8-K item 1.03 in the last 2 years
In their words
17 paragraphs in Risk Factors that were not in the 10-K filed Feb 27, 2025. Quoted as filed.
-
Item 1A · new paragraph · not in the 10-K filed Feb 27, 2025 10-K, ITEM 1A
In order to manufacture the OCS in quantities sufficient to meet our anticipated commercial opportunity, we will need to continue to increase our manufacturing capabilities and retain third parties to sterilize our products. We anticipate that our new
-
Item 1A · new paragraph · not in the 10-K filed Feb 27, 2025 10-K, ITEM 1A
Inventory levels in excess of customer demand may result in a portion of our inventory becoming obsolete or expiring, as well as inventory write-downs or write-offs. Conversely, if we underestimate customer demand for our products or our own requirements
-
Item 1A · new paragraph · not in the 10-K filed Feb 27, 2025 10-K, ITEM 1A
As part of our services offered under our NOP, we have acquired a fleet of fixed-wing aircraft. All of the aircraft we currently operate are standardized variants of a certificated model produced by a single manufacturer. Parts and services from this manufacturer
-
Item 1A · new paragraph · not in the 10-K filed Feb 27, 2025 10-K, ITEM 1A
We may experience disruptions to our business as a result of the relocation of our headquarters and general expansion of our operations. We may experience disruptions as we continue to expand our operations and facilities and execute on our growth strategy. In January 2026, we entered into a lease agreement with the intent to move our…
New risk paragraphs, against peers
Latest 10-K of each, Health care companies closest in revenue
Paragraphs in Risk Factors with nothing like them in the company's 10-K the year before. A count of text, not of risk.
Financial performance
Last 4 fiscal years · 10-K XBRL
| Metric | FY2022 | FY2023 | FY2024 | FY2025 |
|---|---|---|---|---|
| Revenue | $93.5M | $241.6M | $441.5M | $605.5M |
| Net income | −$36.2M | −$25.0M | $35.5M | $190.3M |
| Operating cash flow | −$45.8M | −$13.0M | $48.8M | $192.8M |
| Free cash flow | −$57.7M | −$164.9M | −$80.9M | $133.6M |
Revenue, FY2018 to FY2025
Ten fiscal years, each from its own 10-K · XBRL · USD
$605.5M ▲ 37.1% in FY2025$190.3M ▲ 436.6% in FY2025$133.6M in FY2025
Recent filings
3 filings in the last 30 days · SEC EDGAR
-
Planned saleNov 9, 2026JAMES R. TOBIN (Director) gave notice of a planned sale of 4,059 shares worth about $385K Form 144, approximate sale date Nov 9, 2026
-
8-KNov 5, 2026Quarterly results 8-K item 2.02
-
10-QNov 5, 2026Quarterly report (10-Q) period ended Sep 30, 2026
About the company
TransMedics Group, Inc., Andover, MA · from the 10-K filed Feb 24, 2026
We are a medical technology company transforming organ transplant therapy for end-stage organ failure patients across multiple disease states. We developed the OCS to replace a decades-old standard of care that we believe is significantly limiting access to life-saving transplant therapy for hundreds of thousands of patients worldwide. Our innovative OCS technology replicates many aspects of the organ’s natural living and functioning environment outside of the human body. As such, the OCS represents a paradigm shift that transforms organ preservation for transplantation from a static state to a dynamic environment that enables new capabilities, including organ optimization and assessment.
- Headquarters
- Andover, MA
- Country
- United States
- Reports in
- USD
- Listed on
- Nasdaq
- Fiscal year ends
- December 31
- Last results
- Nov 5, 2026
- Incorporated in
- MA
Email alerts
Sources
The 10-K filed Feb 24, 2026 (open at SEC), compared with the 10-K filed Feb 27, 2025. Numbers from the XBRL of the 10-Ks; filings from SEC EDGAR.
Work with it: Excel workbook · CSV. Google Sheet that stays up to date: paste =IMPORTDATA("https://tickdelta.com/company/TMDX/export.csv") into a cell.