Core & Main, Inc. CNM
- Employees
- 5,600
- Headquarters
- St. Louis, MO
- CEO
- Mark R. Witkowski
- Next results
- around Mar 23, 2027
Where each dollar of revenue went, FY2025
Revenue of $7.6B through the costs to a net profit of $441.0M · income statement of the 10-K
CNM among Industrials peers
Six ratios from the latest 10-K. Each corner is the share of 251 peers the company is above, not a score.
What changed
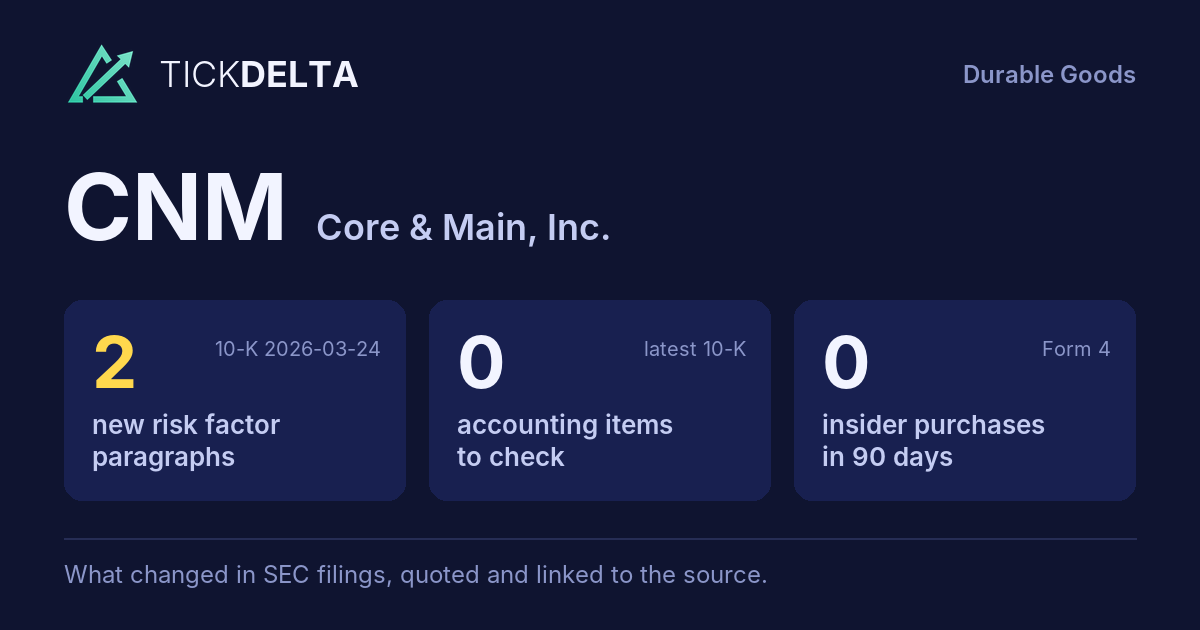
2 new risk paragraphs. 10-K filed Mar 24, 2026 against Mar 25, 2025.
Each row opens the detail with the quote and the filing. A row is a change worth reading, not a verdict.
Accounting checks
11 checks on the latest 10-K. Checks, not verdicts.
0facts worth reading about all 11 checks found nothing to note
-
Receivables -0.5% ($986.0M to $981.0M) vs revenue +2.8% ($7.4B to $7.6B), -3.3 pts apart
-
Cash from operations $650.0M vs net income $441.0M (FY ending Feb 1, 2026)
-
Inventory +8.6% ($908.0M to $986.0M) vs revenue +2.8% ($7.4B to $7.6B), +5.8 pts apart
8 more checks with nothing to note
-
Same auditor in both 10-Ks: PricewaterhouseCoopers LLP
-
No statement of substantial doubt about going concern
-
No 8-K item 4.02 in the last 2 years
-
No NT 10-K or NT 10-Q in the last 2 years
-
The same matters as last year: Revenue Recognition - Net Product Sales
-
No sentence in the 10-K concludes that controls were not effective because of a material weakness
-
No 8-K item 2.06 in the last 2 years
-
No 8-K item 1.03 in the last 2 years
In their words
2 paragraphs in Risk Factors that were not in the 10-K filed Mar 25, 2025. Quoted as filed.
-
Item 1A · new paragraph · not in the 10-K filed Mar 25, 2025 10-K, ITEM 1A
Our competitive environment may be impacted by technological innovation and we may be required to invest in technology to maintain our position in the industry. To sustain and improve our competitive position, we are continually evaluating and investing in technology that can enhance our customer experience and minimize our cost…
New risk paragraphs, against peers
Latest 10-K of each, Industrials companies closest in revenue
Paragraphs in Risk Factors with nothing like them in the company's 10-K the year before. A count of text, not of risk.
Financial performance
Last 4 fiscal years · 10-K XBRL
| Metric | FY2022 | FY2023 | FY2024 | FY2025 |
|---|---|---|---|---|
| Revenue | $6.7B | $6.7B | $7.4B | $7.6B |
| Net income | $366.0M | $371.0M | $411.0M | $441.0M |
| Operating cash flow | $401.0M | $1.1B | $621.0M | $650.0M |
| Free cash flow | $376.0M | $1.0B | $586.0M | $604.0M |
Revenue, FY2019 to FY2025
Ten fiscal years, each from its own 10-K · XBRL · USD
$7.6B ▲ 2.8% in FY2025$441.0M ▲ 7.3% in FY2025$604.0M ▲ 3.1% in FY2025
Recent filings
1 filing in the last 30 days · SEC EDGAR
-
8-KNov 10, 2026Quarterly results 8-K item 2.02
About the company
Core & Main, Inc., St. Louis, MO · from the 10-K filed Mar 24, 2026
Core & Main, Inc. (“Core & Main” and collectively with its subsidiaries, the “Company,” “we,” “our” or “us”) is a holding company and its primary material assets are its direct and indirect ownership interest in Core & Main Holdings, LP, a Delaware limited partnership (“Holdings”), and deferred tax assets associated with this ownership. Core & Main is a leading specialty distributor dedicated to advancing reliable infrastructure with local service, nationwide.
- Headquarters
- St. Louis, MO
- Country
- United States
- Reports in
- USD
- Listed on
- NYSE
- Fiscal year ends
- January 31
- Last results
- Nov 10, 2026
- Incorporated in
- DE
Employees, at the top of the page: "As of February 1, 2026, we employed approximately 5,600 associates, the majority of whom are assigned to local branches to support our customers and their project needs" (10-K). Address and exchange: SEC's company file.
Email alerts
Sources
The 10-K filed Mar 24, 2026 (open at SEC), compared with the 10-K filed Mar 25, 2025. Numbers from the XBRL of the 10-Ks; filings from SEC EDGAR.
Work with it: Excel workbook · CSV. Google Sheet that stays up to date: paste =IMPORTDATA("https://tickdelta.com/company/CNM/export.csv") into a cell.