SharkNinja, Inc. SN
At SharkNinja, our mission is to positively impact people’s lives every day in every home in our global markets. 10-K, Item 1
- Headquarters
- Needham, MA
- CEO
- Mark Barrocas
- Next results
- around Feb 10, 2027
Where each dollar of revenue went, FY2025
Revenue of $6.4B through the costs to a net profit of $701.4M · income statement of the 10-K
SN among Consumer discretionary peers
Six ratios from the latest 10-K. Each corner is the share of 168 peers the company is above, not a score.
What changed
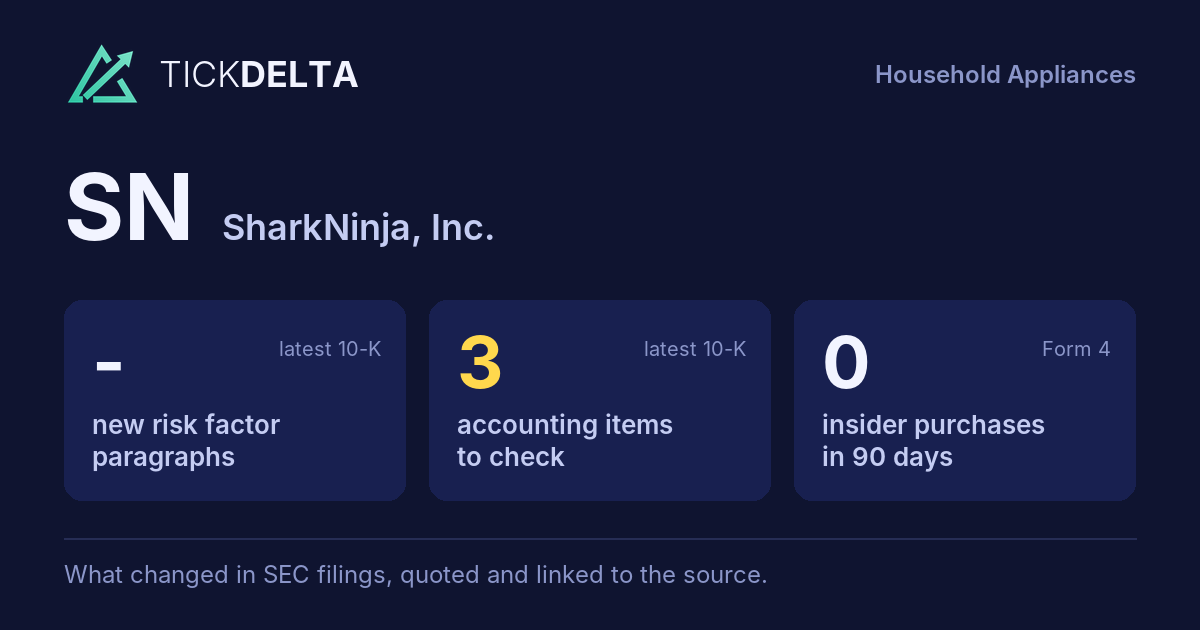
3 accounting facts worth reading about.
Each row opens the detail with the quote and the filing. A row is a change worth reading, not a verdict.
Accounting checks
10 checks on the latest 10-K. Checks, not verdicts.
3facts worth reading about the other 7 checks found nothing to note
-
Receivables growing faster than revenueReceivables +31.6% ($1.3B to $1.7B) vs revenue +15.7% ($5.5B to $6.4B), +15.9 pts apart
-
Cash from operations lower than net incomeCash from operations $634.1M vs net income $701.4M (FY ending Dec 31, 2025)
-
Material weakness in internal control“As a result of these material weaknesses, our management concluded that our disclosure controls and procedures were not effective as of December 31, 2025.”
-
Inventory +11.4% ($900.0M to $1.0B) vs revenue +15.7% ($5.5B to $6.4B), -4.4 pts apart
6 more checks with nothing to note
-
Auditor names not available for both 10-Ks; no 8-K item 4.01
-
No statement of substantial doubt about going concern
-
No 8-K item 4.02 in the last 2 years
-
No NT 10-K or NT 10-Q in the last 2 years
-
No 8-K item 2.06 in the last 2 years
-
No 8-K item 1.03 in the last 2 years
In their words
No new paragraphs in Risk Factors
No new paragraphs in Risk Factors, or fewer than two 10-Ks to compare.
Financial performance
Last 4 fiscal years · 10-K XBRL
| Metric | FY2022 | FY2023 | FY2024 | FY2025 |
|---|---|---|---|---|
| Revenue | $3.7B | $4.3B | $5.5B | $6.4B |
| Net income | $232.4M | $167.1M | $438.7M | $701.4M |
| Operating cash flow | $205.0M | $280.6M | $446.6M | $634.1M |
| Free cash flow | $124.7M | $157.9M | $308.9M | $488.1M |
Revenue, FY2021 to FY2025
Ten fiscal years, each from its own 10-K · XBRL · USD
$6.4B ▲ 15.7% in FY2025$701.4M ▲ 59.9% in FY2025$488.1M ▲ 58.0% in FY2025
Recent filings
6 filings in the last 30 days · SEC EDGAR
-
Planned saleNov 6, 2026Neil Shah (Officer) gave notice of a planned sale of 50,000 shares worth about $10.9M Form 144, approximate sale date Nov 6, 2026
-
Planned saleNov 6, 2026Mark Barrocas (Officer, Director) gave notice of a planned sale of 120,000 shares worth about $26.1M Form 144, approximate sale date Nov 6, 2026
-
Planned saleNov 6, 2026Shah Neil B. (Officer) gave notice of a planned sale of 20,000 shares worth about $4.5M Form 144, approximate sale date Nov 6, 2026
-
Planned saleNov 4, 2026Mark Barrocas (Chief Executive Officer) adopted a 10b5-1 trading plan reported in the 10-Q, up to 750,000 shares, runs to Dec 8, 2027
-
8-KNov 4, 2026Quarterly results 8-K item 2.02
About the company
SharkNinja, Inc., Needham, MA · from the 10-K filed Mar 2, 2026
At SharkNinja, our mission is to positively impact people’s lives every day in every home in our global markets. The Company has identified two operating segments, Domestic and International, which are aggregated into one reportable segment that derives revenues from customers through the sale of the Company’s small household appliances, which are sold under two brands, Shark and Ninja. SharkNinja: World-Class Household Appliance Brands Built on Continuous, Disruptive Innovation
- Headquarters
- Needham, MA
- Country
- United States
- Reports in
- USD
- Listed on
- NYSE
- Fiscal year ends
- December 31
- Last results
- Nov 4, 2026
- Incorporated in
- Cayman Islands
Email alerts
Sources
Numbers from the XBRL of the 10-Ks; filings from SEC EDGAR.
Work with it: Excel workbook · CSV. Google Sheet that stays up to date: paste =IMPORTDATA("https://tickdelta.com/company/SN/export.csv") into a cell.