Loar Holdings Inc. LOAR
We specialize in the design, manufacture, and sale of niche aerospace and defense components that are essential for today’s aircraft and aerospace and defense systems. 10-K, Item 1
- Headquarters
- White Plains, NY
- CEO
- Dirkson Charles
- Next results
- around Feb 25, 2027
Where each dollar of revenue went, FY2025
Revenue of $496.3M through the costs to a net profit of $72.1M · income statement of the 10-K
LOAR among Industrials peers
Six ratios from the latest 10-K. Each corner is the share of 251 peers the company is above, not a score.
What changed
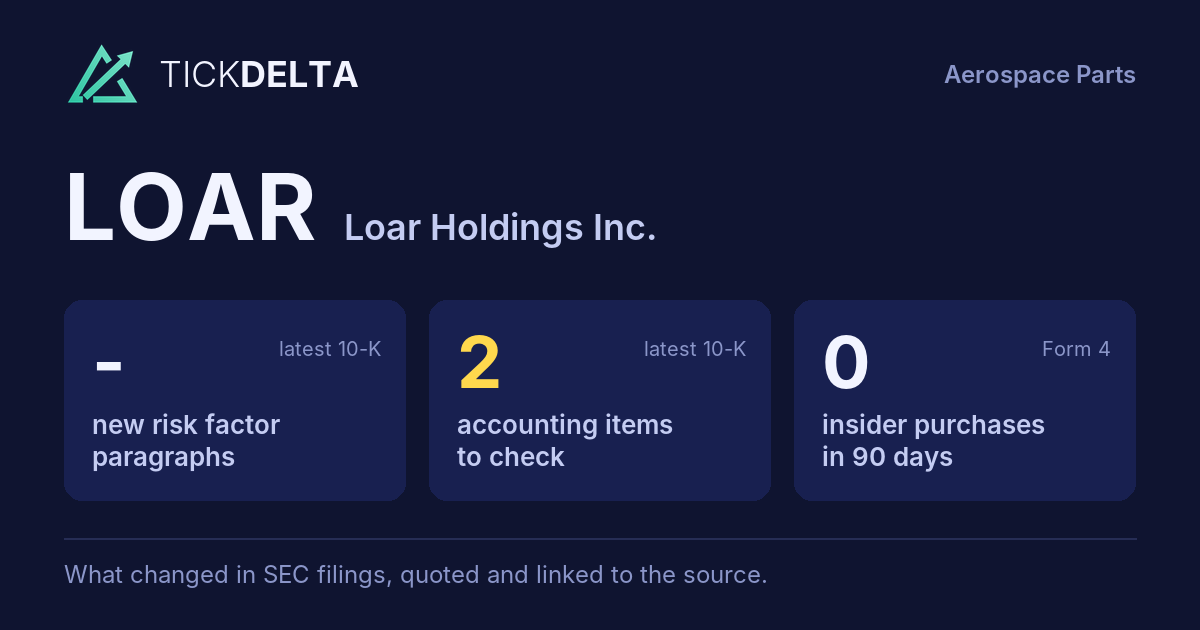
2 accounting facts worth reading about.
Each row opens the detail with the quote and the filing. A row is a change worth reading, not a verdict.
Accounting checks
11 checks on the latest 10-K. Checks, not verdicts.
2facts worth reading about the other 9 checks found nothing to note
-
Receivables growing faster than revenueReceivables +37.9% ($63.8M to $88.0M) vs revenue +23.2% ($402.8M to $496.3M), +14.7 pts apart
-
Critical audit matters changedNew this year: Revenue Recognition (“The Company’s revenue was $496.3 million for the year ended December 31, 2025. As explained in Note 4 to the consolidated financial statements, revenue is recognized in an amount that reflects the consideration the Company expects to be entitled to in exchange for those goods or services when contro”); Business Combinations (“As described in Note 2 to the consolidated financial statements, the Company completed the acquisition of LMB Fans & Motors (LMB) in December 2025 for consideration of $474.8 million. This acquisition has been accounted for as a business combination and the acquisition accounting was disclosed as pr”)
-
Cash from operations $112.3M vs net income $72.1M (FY ending Dec 31, 2025)
8 more checks with nothing to note
-
Inventory +17.7% ($92.6M to $109.0M) vs revenue +23.2% ($402.8M to $496.3M), -5.5 pts apart
-
Same auditor in both 10-Ks: Ernst & Young LLP
-
No statement of substantial doubt about going concern
-
No 8-K item 4.02 in the last 2 years
-
No NT 10-K or NT 10-Q in the last 2 years
-
No sentence in the 10-K concludes that controls were not effective because of a material weakness
-
No 8-K item 2.06 in the last 2 years
-
No 8-K item 1.03 in the last 2 years
In their words
No new paragraphs in Risk Factors
No new paragraphs in Risk Factors, or fewer than two 10-Ks to compare.
Financial performance
Last 3 fiscal years · 10-K XBRL
| Metric | FY2023 | FY2024 | FY2025 |
|---|---|---|---|
| Revenue | $317.5M | $402.8M | $496.3M |
| Net income | −$4.6M | $22.2M | $72.1M |
| Operating cash flow | $12.8M | $55.0M | $112.3M |
Revenue, FY2023 to FY2025
Ten fiscal years, each from its own 10-K · XBRL · USD
$496.3M ▲ 23.2% in FY2025$72.1M ▲ 224.5% in FY2025
Recent filings
2 filings in the last 30 days · SEC EDGAR
-
8-KNov 5, 2026Quarterly results 8-K item 2.02
-
10-QNov 5, 2026Quarterly report (10-Q) period ended Sep 30, 2026
About the company
Loar Holdings Inc., White Plains, NY · from the 10-K filed Mar 2, 2026
We specialize in the design, manufacture, and sale of niche aerospace and defense components that are essential for today’s aircraft and aerospace and defense systems. Our focus on mission-critical, highly engineered solutions with high-intellectual property content resulted in approximately 89% of our 2025 net sales being derived from proprietary products where we believe we hold market-leading positions. Furthermore, our products have significant aftermarket exposure, which has historically generated predictable and recurring revenue. We estimate that approximately 55% of our 2025 net sales were derived from aftermarket products.
- Headquarters
- White Plains, NY
- Country
- United States
- Reports in
- USD
- Listed on
- NYSE
- Fiscal year ends
- December 31
- Last results
- Nov 5, 2026
- Incorporated in
- DE
Email alerts
Sources
Numbers from the XBRL of the 10-Ks; filings from SEC EDGAR.
Work with it: Excel workbook · CSV. Google Sheet that stays up to date: paste =IMPORTDATA("https://tickdelta.com/company/LOAR/export.csv") into a cell.