Apple Inc. AAPL
The Company designs, manufactures and markets smartphones, personal computers, tablets, wearables and accessories, and sells a variety of related services. 10-K, Item 1
- Employees
- 167,000
- Headquarters
- Cupertino, CA
- CEO
- John Ternus
- Next results
- around Jan 28, 2027
Where each dollar of revenue went, FY2026
Revenue of $478.8B through the costs to a net profit of $132.2B · income statement of the 10-K
AAPL among Technology peers
Six ratios from the latest 10-K. Each corner is the share of 74 peers the company is above, not a score.
What changed
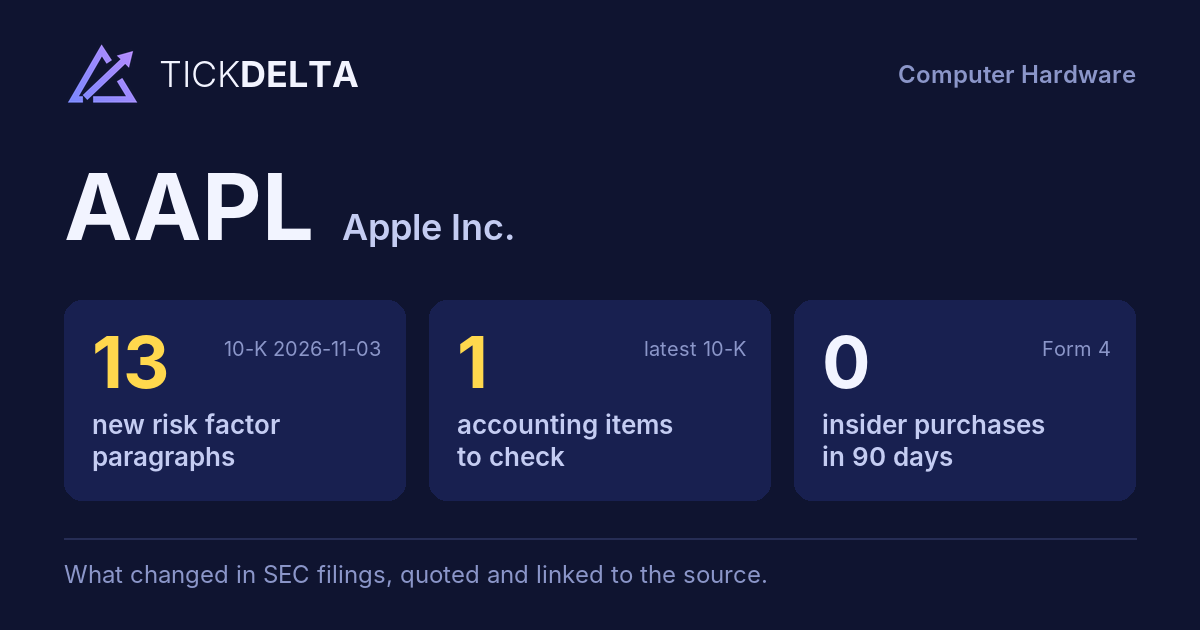
13 new risk paragraphs and 1 accounting fact worth reading about. 10-K filed Nov 3, 2026 against Oct 31, 2025.
Each row opens the detail with the quote and the filing. A row is a change worth reading, not a verdict.
Accounting checks
11 checks on the latest 10-K. Checks, not verdicts.
1fact worth reading about the other 10 checks found nothing to note
-
Inventory growing faster than revenueInventory +154.3% vs revenue +15.1% (+139.2 pts)
-
Receivables +10.2% vs revenue +15.1% (-4.9 pts)
9 more checks with nothing to note
-
Cash from operations $145.1B vs net income $132.2B (FY ending Sep 26, 2026)
-
Same auditor in both 10-Ks: Ernst & Young LLP
-
No statement of substantial doubt about going concern
-
No 8-K item 4.02 in the last 2 years
-
No NT 10-K or NT 10-Q in the last 2 years
-
The same matters as last year: Uncertain Tax Positions
-
No sentence in the 10-K concludes that controls were not effective because of a material weakness
-
No 8-K item 2.06 in the last 2 years
-
No 8-K item 1.03 in the last 2 years
In their words
13 paragraphs in Risk Factors that were not in the 10-K filed Oct 31, 2025. Quoted as filed.
-
Item 1A · new paragraph · not in the 10-K filed Oct 31, 2025 10-K, ITEM 1A
The Company competes with a number of companies in the development and deployment of artificial intelligence and has made significant investments in building artificial intelligence features and related infrastructure across its products and services. Failure to successfully develop, deploy or differentiate artificial intelligence…
-
Item 1A · new paragraph · not in the 10-K filed Oct 31, 2025 10-K, ITEM 1A
The Company’s business, including its artificial intelligence and machine learning offerings, also depends on access to sufficient compute capacity and storage resources. Demand for cloud compute and storage services and other artificial intelligence infrastructure has increased substantially across the technology industry, resulting in…
-
Item 1A · new paragraph · not in the 10-K filed Oct 31, 2025 10-K, ITEM 1A
The Company distributes third-party applications through the App Store. Where applicable, the Company may retain a commission from sales of applications and sales of digital services or goods initiated within an application. If third-party developers use alternative methods of distribution and payment for their applications and digital…
-
Item 1A · new paragraph · not in the 10-K filed Oct 31, 2025 10-K, ITEM 1A
The rapid advancement and widespread dissemination of artificial intelligence technologies significantly increases the risks associated with cybersecurity attacks. For example, artificial intelligence technologies are producing highly targeted phishing campaigns, automating the discovery or exploitation of vulnerabilities, generating…
New risk paragraphs, against peers
Latest 10-K of each, Technology companies closest in revenue
Paragraphs in Risk Factors with nothing like them in the company's 10-K the year before. A count of text, not of risk.
From the same starting line, FY2017 to FY2026
Revenue, net income and free cash flow, each set to 100 in FY2017. What happened, from the 10-Ks. Not a forecast.
Financial performance
Last 4 fiscal years · 10-K XBRL
| Metric | FY2023 | FY2024 | FY2025 | FY2026 |
|---|---|---|---|---|
| Revenue | $383.3B | $391.0B | $416.2B | $478.8B |
| Net income | $97.0B | $93.7B | $112.0B | $132.2B |
| Operating cash flow | $110.5B | $118.3B | $111.5B | $145.1B |
| Free cash flow | $99.6B | $108.8B | $98.8B | $136.1B |
Revenue, FY2017 to FY2026
Ten fiscal years, each from its own 10-K · XBRL · USD
$478.8B ▲ 15.1% in FY2026$132.2B ▲ 18.0% in FY2026$136.1B ▲ 37.8% in FY2026
Recent filings
3 filings in the last 30 days · SEC EDGAR
-
8-KNov 9, 2026Other events 8-K item 8.01
-
10-KNov 3, 2026Annual report (10-K) period ended Sep 26, 2026
-
8-KNov 2, 2026Quarterly results 8-K item 2.02
About the company
Apple Inc., Cupertino, CA · from the 10-K filed Nov 3, 2026
The Company designs, manufactures and markets smartphones, personal computers, tablets, wearables and accessories, and sells a variety of related services. The Company’s fiscal year is the 52- or 53-week period that ends on the last Saturday of September. iPhone® is the Company’s line of smartphones based on its iOS operating system. The iPhone line includes iPhone Duo™, iPhone 18 Pro, iPhone Air®, iPhone 17, iPhone 17e and iPhone 16.
- Headquarters
- Cupertino, CA
- Country
- United States
- Listed on
- Nasdaq
- Fiscal year ends
- September 26
- Last results
- Nov 2, 2026
- Incorporated in
- CA
Employees, at the top of the page: "As of September 26, 2026, the Company had approximately 167,000 full-time equivalent employees" (10-K). Address and exchange: SEC's company file.
Email alerts
Sources
The 10-K filed Nov 3, 2026 (open at SEC), compared with the 10-K filed Oct 31, 2025. Numbers from the XBRL of the 10-Ks; filings from SEC EDGAR.
Work with it: Excel workbook · CSV. Google Sheet that stays up to date: paste =IMPORTDATA("https://tickdelta.com/company/AAPL/export.csv") into a cell.