Argan Inc AGX
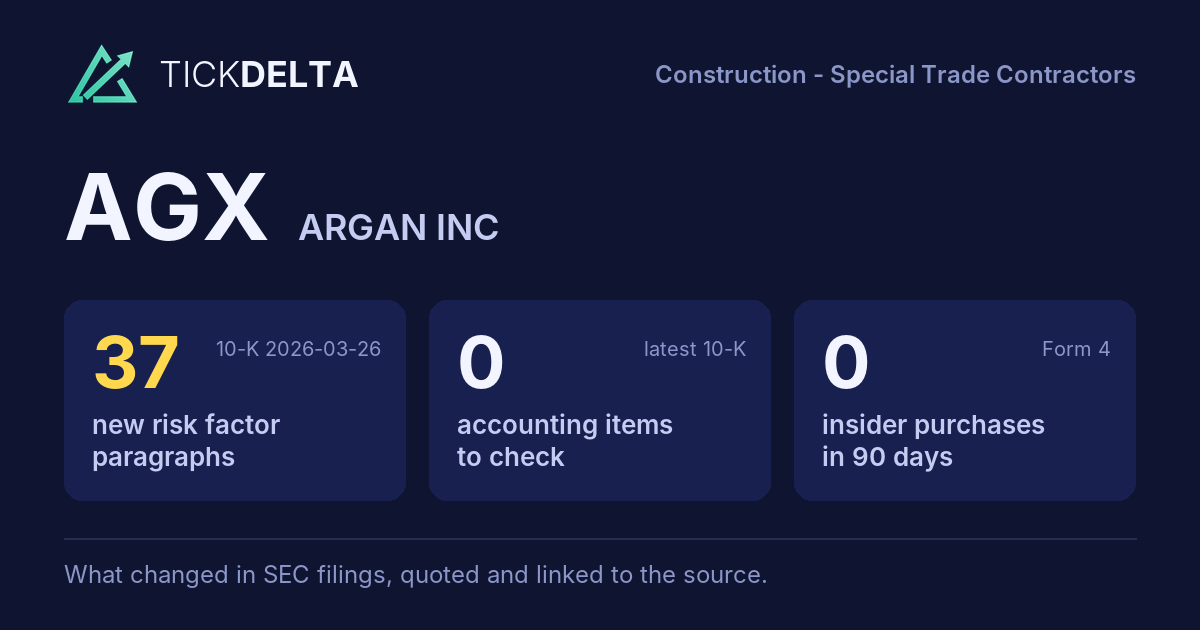
The biggest changes in the 10-K filed Mar 26, 2026, in management's words
10-K, Item 7This fiscal year against the last, and the sentences in the MD&A where management explains each change. Tickdelta picks sentences that name the line, a direction and a cause. It does not write explanations of its own.
Cash from operations
Big change, FY to Jan 31, 2026 vs Jan 31, 2025
The MD&A has no sentence that names a cause for this change.
Net income
Big change, FY to Jan 31, 2026 vs Jan 31, 2025
The MD&A has no sentence that names a cause for this change.
Gross margin
Big change, FY to Jan 31, 2026 vs Jan 31, 2025
“The increase in gross profit margin between periods was primarily attributable to the changing mix of projects and contract types.”
Read it in the 10-K
Operating margin
Big change, FY to Jan 31, 2026 vs Jan 31, 2025
The MD&A has no sentence that names a cause for this change.
Revenue
Change, FY to Jan 31, 2026 vs Jan 31, 2025
“The increase in revenues between years was partially offset by decreased construction activities associated with the Trumbull Energy Center, the Midwest Solar and Battery Projects, the Louisiana LNG Facility, the ESB FlexGen Peaker Plants, and the Shannonbridge Power Project, as those projects are in their later stages or have fully concluded.”
Read it in the 10-K
“The revenues of the Industrial segment were essentially flat at $167.6 million for Fiscal 2026 compared to $167.6 million for Fiscal 2025, as increased field services construction activities were largely offset by decreased supporting vessel fabrication work between periods.”
Read it in the 10-K
What management said, year by year
The cause given in each 10-K, 2 fiscal years, newest first · MD&A (Item 7)
Each bar is how the line changed that year (from the same 10-K's XBRL). Under it, the sentence in that year's MD&A that names the line, a direction and a cause, word for word. A year with no sentence says so.
Revenue
2 of 2 years explained-
FY 2026 +8.1%
“The increase in revenues between years was partially offset by decreased construction activities associated with the Trumbull Energy Center, the Midwest Solar and Battery Projects, the Louisiana LNG Facility, the ESB FlexGen Peaker Plants, and the Shannonbridge Power Project, as those projects are in their later stages or have fully concluded.”
Read it in the FY 2026 10-K“The revenues of the Industrial segment were essentially flat at $167.6 million for Fiscal 2026 compared to $167.6 million for Fiscal 2025, as increased field services construction activities were largely offset by decreased supporting vessel fabrication work between periods.”
Read it in the FY 2026 10-K -
FY 2025 +52.5%
“The increase in revenues between years was partially offset by decreased construction activities associated with the Guernsey Power Station project, the ESB FlexGen Peaker Plants, the Shannonbridge Power Project and the Kilroot Project, as those projects have concluded.”
Read it in the FY 2025 10-K“The revenues of industrial construction services increased by $24.8 million, or 17.4%, to $167.6 million for Fiscal 2025 compared with revenues of $142.8 million for Fiscal 2024 as the amounts of field services construction activities increased meaningfully between periods, partially offset by decreased supporting vessel fabrication work between periods.”
Read it in the FY 2025 10-K
Gross margin
2 of 2 years explained-
FY 2026 +4.4 pts
“The increase in gross profit margin between periods was primarily attributable to the changing mix of projects and contract types.”
Read it in the FY 2026 10-K -
FY 2025 +2.0 pts
“The gross profit percentage increased between periods primarily due to the changing mix of projects and contract types.”
Read it in the FY 2025 10-K
Operating margin
0 of 2 years explained-
FY 2026 +4.2 pts
The FY 2026 MD&A has no sentence that names a cause for this change.
-
FY 2025 +3.7 pts
The FY 2025 MD&A has no sentence that names a cause for this change.
Net income
0 of 2 years explained-
FY 2026 +61.2%
The FY 2026 MD&A has no sentence that names a cause for this change.
-
FY 2025 +164.1%
The FY 2025 MD&A has no sentence that names a cause for this change.
Cash from operations
0 of 2 years explained-
FY 2026 +147.5%
The FY 2026 MD&A has no sentence that names a cause for this change.
-
FY 2025 +43.4%
The FY 2025 MD&A has no sentence that names a cause for this change.
Changes are computed from the XBRL figures in the same 10-K. Hover a number to see the line item. Open the 10-K
Sources
The Management's Discussion and Analysis (Item 7) of the latest 10-K, quoted word for word; the changes are computed from the same 10-K's XBRL.
Also
Financials: the numbers year by year.
Work with it
Excel workbook · CSV. Google Sheet that stays up to date: paste =IMPORTDATA("https://tickdelta.com/company/AGX/export.csv") into a cell.