Arcbest Corp ARCB
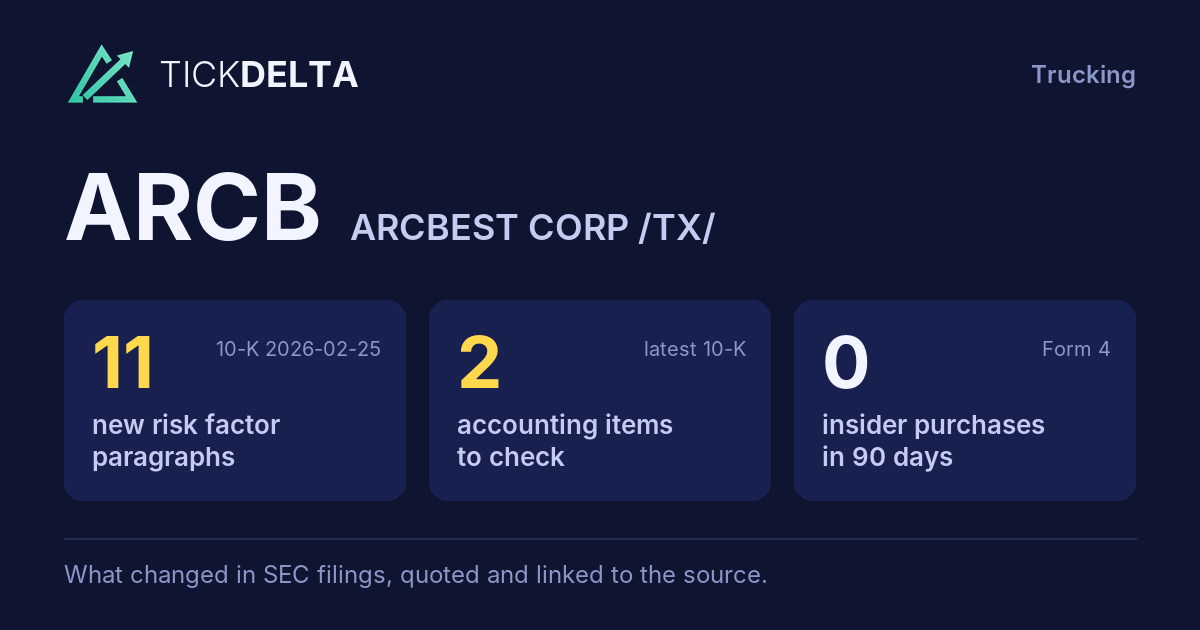
The biggest changes in the 10-K filed Feb 25, 2026, in management's words
10-K, Item 7This fiscal year against the last, and the sentences in the MD&A where management explains each change. Tickdelta picks sentences that name the line, a direction and a cause. It does not write explanations of its own.
Net income
Big change, FY to Dec 31, 2025 vs Dec 31, 2024
“Our 2025 effective tax rate varied from the statutory rate due to state income taxes, an increase in valuation allowances, and federal research and development and employment tax credits.”
Read it in the 10-K
Operating margin
Big change, FY to Dec 31, 2025 vs Dec 31, 2024
“Consolidated operating income decreased $154.1 million year-over-year to an operating income of $90.3 million in 2025, reflecting the revenue decline, increases in Asset-Based segment salaries, wages and benefits; and the reduction in the contingent earnout consideration accrual during 2024, offset by lower purchased transportation costs and lower employee costs in the Asset-Light segment.”
Read it in the 10-K
“Labor costs, which are reported in operating expenses as salaries, wages, and benefits increased $40.7 million for 2025, compared to 2024, primarily due to contract rate increases under the 2023 ABF NMFA, as previously discussed in the Asset-Based Segment Overview section, an increase in headcount to align with higher shipment levels and increased tonnage, and the effect of rising healthcare costs.”
Read it in the 10-K
Cash from operations
Big change, FY to Dec 31, 2025 vs Dec 31, 2024
The MD&A has no sentence that names a cause for this change.
Revenue
Change, FY to Dec 31, 2025 vs Dec 31, 2024
“The revenue decline is primarily attributable to lower market rates and shipment levels for our Asset-Light shipping and logistics services in a soft market environment, which resulted in a decrease in Asset-Light revenues of 9.4%.”
Read it in the 10-K
“Lower revenue per shipment, partially offset by higher shipment levels in our Asset-Based segment, resulted in a 0.6% decrease in Asset-Based revenues and contributed to the year-over-year decrease in consolidated revenues for 2025.”
Read it in the 10-K
What management said, year by year
The cause given in each 10-K, 2 fiscal years, newest first · MD&A (Item 7)
Each bar is how the line changed that year (from the same 10-K's XBRL). Under it, the sentence in that year's MD&A that names the line, a direction and a cause, word for word. A year with no sentence says so.
Revenue
2 of 2 years explained-
FY 2025 -4.0%
“The revenue decline is primarily attributable to lower market rates and shipment levels for our Asset-Light shipping and logistics services in a soft market environment, which resulted in a decrease in Asset-Light revenues of 9.4%.”
Read it in the FY 2025 10-K“Lower revenue per shipment, partially offset by higher shipment levels in our Asset-Based segment, resulted in a 0.6% decrease in Asset-Based revenues and contributed to the year-over-year decrease in consolidated revenues for 2025.”
Read it in the FY 2025 10-K -
FY 2024 -5.6%
“The year-over-year decrease in consolidated revenues for 2024 reflects a 4.2% decrease in our Asset-Based revenues and a 7.6% decrease in our Asset-Light revenues.”
Read it in the FY 2024 10-K“The elimination of revenues reported within the “Other and eliminations” line of consolidated revenues increased 1.6% for 2024, compared to 2023, reflecting year-over-year changes in intersegment business levels among our operating segments.”
Read it in the FY 2024 10-K
Operating margin
2 of 2 years explained-
FY 2025 -3.6 pts
“Consolidated operating income decreased $154.1 million year-over-year to an operating income of $90.3 million in 2025, reflecting the revenue decline, increases in Asset-Based segment salaries, wages and benefits; and the reduction in the contingent earnout consideration accrual during 2024, offset by lower purchased transportation costs and lower employee costs in the Asset-Light segment.”
Read it in the FY 2025 10-K“Labor costs, which are reported in operating expenses as salaries, wages, and benefits increased $40.7 million for 2025, compared to 2024, primarily due to contract rate increases under the 2023 ABF NMFA, as previously discussed in the Asset-Based Segment Overview section, an increase in headcount to align with higher shipment levels and increased tonnage, and the effect of rising healthcare costs.”
Read it in the FY 2025 10-K -
FY 2024 +2.0 pts
“Consolidated operating income increased by $71.8 million year-over-year reflecting the $90.3 million reduction in the contingent earnout consideration accrual during 2024 and a decrease in operating expenses due to lower purchased transportation costs in both of our operating segments and lower employee costs in the Asset-Light segment from continued alignment of costs to the market environment, offset partially by lower revenues in both the Asset-Light and Asset-Based segments and higher employee costs in the Asset-Based segment due to union wage and benefit rate increases.”
Read it in the FY 2024 10-K“Excluding the change in fair value of contingent earnout consideration and lower asset impairment charges and legal settlement expenses in 2024, as previously discussed, the decrease in operating expenses, compared to 2023, is due primarily to lower outside service costs and employee-related cost reductions in relation to lower business levels.”
Read it in the FY 2024 10-K
Net income
1 of 2 years explained-
FY 2025 -65.5%
“Our 2025 effective tax rate varied from the statutory rate due to state income taxes, an increase in valuation allowances, and federal research and development and employment tax credits.”
Read it in the FY 2025 10-K -
FY 2024 -11.0%
The FY 2024 MD&A has no sentence that names a cause for this change.
Cash from operations
0 of 2 years explained-
FY 2025 -19.9%
The FY 2025 MD&A has no sentence that names a cause for this change.
-
FY 2024 -11.3%
The FY 2024 MD&A has no sentence that names a cause for this change.
Changes are computed from the XBRL figures in the same 10-K. Hover a number to see the line item. Open the 10-K
Sources
The Management's Discussion and Analysis (Item 7) of the latest 10-K, quoted word for word; the changes are computed from the same 10-K's XBRL.
Also
Financials: the numbers year by year.
Work with it
Excel workbook · CSV. Google Sheet that stays up to date: paste =IMPORTDATA("https://tickdelta.com/company/ARCB/export.csv") into a cell.