BENFranklin Resources
Franklin Templeton, Inc., formerly named Franklin Resources, Inc. (“Franklin”), is a holding company with subsidiaries operating under our Franklin Templeton® and/or subsidiary brand names. 10-K, Item 1
- Employees
- 9,900
- Headquarters
- San Mateo, CA
- CEO
- Jennifer M. Johnson
- Next results
- around Jan 29, 2027
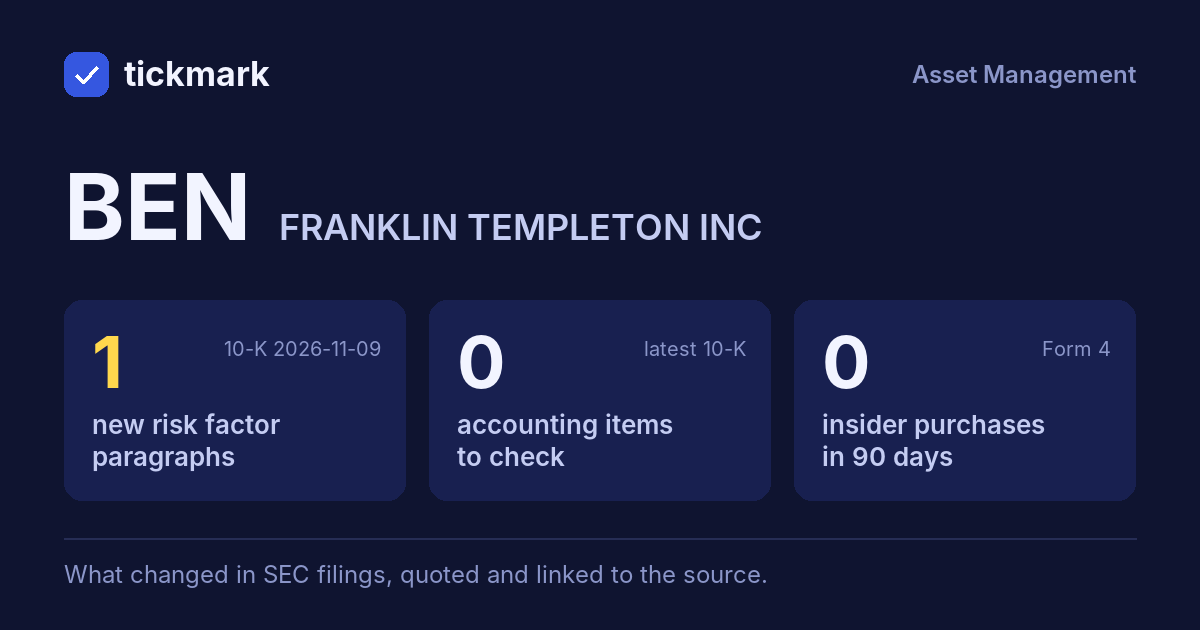
The biggest changes in the 10-K filed 2026-11-09, this fiscal year against the last, and the sentences in the MD&A (Item 7) where management explains them, quoted word for word. Tickdelta picks sentences that name the line, a direction and a cause. It does not write explanations of its own.
Net income
+104.9% Big change FY to 2026-09-30 vs 2025-09-30The MD&A has no sentence that names a cause for this change. That can be worth a question: ask about the filing.
Operating margin
6.9% → 12.5% (+5.6 pts) Big change FY to 2026-09-30 vs 2025-09-30“General, administrative and other operating expenses increased $147.7 million in fiscal year 2026, primarily due to a $100.0 million regulatory settlement, an increase of $33.2 million in the fair value of a contingent consideration liability, and an increase of $21.5 million in fund-related expenses due to higher placement and platform fees.”
Read it in the 10-K ↗
Cash from operations
-21.5% Big change FY to 2026-09-30 vs 2025-09-30“Net cash provided by operating activities decreased in fiscal year 2026 primarily due to higher net purchases of investments by consolidated investment products partially offset by an increase in accounts payable, accrued expenses and other liabilities.”
Read it in the 10-K ↗
Revenue
+7.3% FY to 2026-09-30 vs 2025-09-30“Sales-based fees increased $19.7 million in fiscal year 2026 primarily due to a $10.3 million increase in contingent sales charges, driven by increased redemptions, and an increase of 13% in commissionable sales, partially offset by a higher mix of non-U.S. sales, which generate lower fees.”
Read it in the 10-K ↗
“Sales-based expenses increased $8.6 million in fiscal year 2026 primarily due to an increase of 13% in commissionable sales, partially offset by a higher mix of non-U.S. sales.”
Read it in the 10-K ↗
Changes are computed from the XBRL figures in the same 10-K. Hover a number to see the line item. Open the 10-K ↗
Work on BEN in a spreadsheet:
Excel workbook (a sheet per section, ten years by column, charts, links to the filings) ·
CSV.
For a Google Sheet that stays up to date, paste =IMPORTDATA("https://tickdelta.com/company/BEN/export.csv") into a cell.