CBRE Group CBRE
CBRE is the world’s largest commercial real estate services and investments firm (based on 2025 revenue). 10-K, Item 1
- Employees
- 155,000
- Headquarters
- Dallas, TX
- CEO
- Robert E. Sulentic
- Next results
- around Feb 11, 2027
Where each dollar of revenue went, FY2025
Revenue of $40.5B through the costs to a net profit of $1.2B · income statement of the 10-K
CBRE among Real estate peers
Six ratios from the latest 10-K. Each corner is the share of 28 peers the company is above, not a score.
What changed
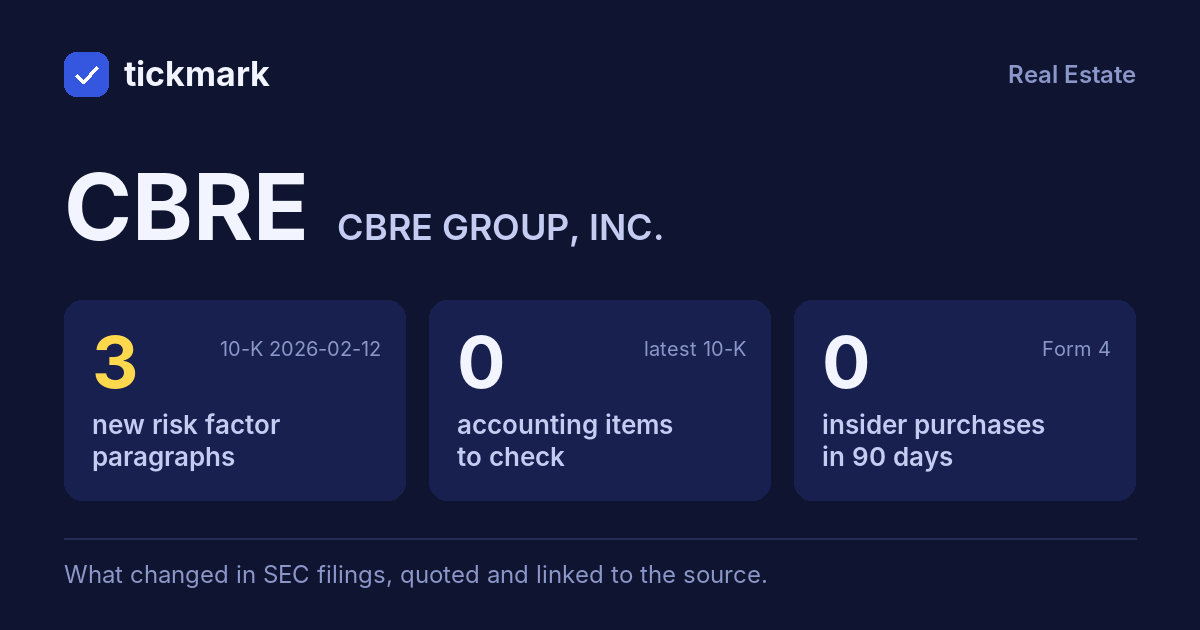
3 new risk paragraphs. 10-K filed Feb 12, 2026 against Feb 14, 2025.
Each row opens the detail with the quote and the filing. A row is a change worth reading, not a verdict.
Accounting checks
10 checks on the latest 10-K. Checks, not verdicts.
0facts worth reading about all 10 checks found nothing to note
-
Receivables +18.3% vs revenue +13.4% (+4.9 pts)
-
Cash from operations $1.6B vs net income $1.2B (FY ending Dec 31, 2025)
-
Same auditor in both 10-Ks: KPMG LLP
7 more checks with nothing to note
-
No statement of substantial doubt about going concern
-
No 8-K item 4.02 in the last 2 years
-
No NT 10-K or NT 10-Q in the last 2 years
-
The same matters as last year: Assessment of gross unrecognized tax benefits
-
No sentence in the 10-K concludes that controls were not effective because of a material weakness
-
No 8-K item 2.06 in the last 2 years
-
No 8-K item 1.03 in the last 2 years
In their words
3 paragraphs in Risk Factors that were not in the 10-K filed Feb 14, 2025. Quoted as filed.
-
Item 1A · new paragraph · not in the 10-K filed Feb 14, 2025 10-K, ITEM 1A
We have invested in enhancing our service and product offerings globally. If we do not successfully execute these initiatives or effectively manage the risks inherent in operating on a global scale, our business, financial condition, or results of operations could be materially adversely affected. Additionally, political, regulatory,…
-
Item 1A · new paragraph · not in the 10-K filed Feb 14, 2025 10-K, ITEM 1A
The protection of our brand, including related trademarks, may require the expenditure of significant financial and operational resources.
New risk paragraphs, against peers
Latest 10-K of each, Real estate companies closest in revenue
Paragraphs in Risk Factors with nothing like them in the company's 10-K the year before. A count of text, not of risk.
Financial performance
Last 4 fiscal years · 10-K XBRL
| Metric | FY2022 | FY2023 | FY2024 | FY2025 |
|---|---|---|---|---|
| Revenue | $30.8B | $31.9B | $35.8B | $40.5B |
| Net income | $1.4B | $986.0M | $968.0M | $1.2B |
| Operating cash flow | $1.6B | $480.0M | $1.7B | $1.6B |
| Free cash flow | $1.4B | $175.0M | $1.4B | $1.2B |
Revenue, FY2016 to FY2025
Ten fiscal years, each from its own 10-K · XBRL · USD
$40.5B ▲ 13.4% in FY2025$1.2B ▲ 19.5% in FY2025$1.2B ▼ 14.8% in FY2025
Recent filings
5 filings in the last 30 days · SEC EDGAR
-
8-KNov 5, 2026Material agreement signed, New debt or obligation 8-K items 1.01, 2.03
-
8-KOct 28, 2026Material agreement signed 8-K item 1.01
-
8-KOct 22, 2026Quarterly results 8-K item 2.02
-
10-QOct 22, 2026Quarterly report (10-Q) period ended Sep 30, 2026
-
8-KOct 20, 2026Regulation FD disclosure 8-K item 7.01
About the company
CBRE Group, Dallas, TX · from the 10-K filed Feb 12, 2026
CBRE is the world’s largest commercial real estate services and investments firm (based on 2025 revenue). We derive competitive advantage from our considerable scale and ability to offer integrated solutions for real estate investors and occupiers in more than 100 countries. We are global market leaders in most of our business lines and drive significant growth by helping clients optimize real estate costs, value, investment returns and workplace experiences.
- Headquarters
- Dallas, TX
- Country
- United States
- Reports in
- USD
- Listed on
- NYSE
- Fiscal year ends
- December 31
- Last results
- Oct 22, 2026
- Incorporated in
- DE
Employees, at the top of the page: "At December 31, 2025, we had more than 155,000 employees (including Turner & Townsend employees) worldwide" (10-K). Address and exchange: SEC's company file.
Email alerts
Sources
The 10-K filed Feb 12, 2026 (open at SEC), compared with the 10-K filed Feb 14, 2025. Numbers from the XBRL of the 10-Ks; filings from SEC EDGAR.
Work with it: Excel workbook · CSV. Google Sheet that stays up to date: paste =IMPORTDATA("https://tickdelta.com/company/CBRE/export.csv") into a cell.