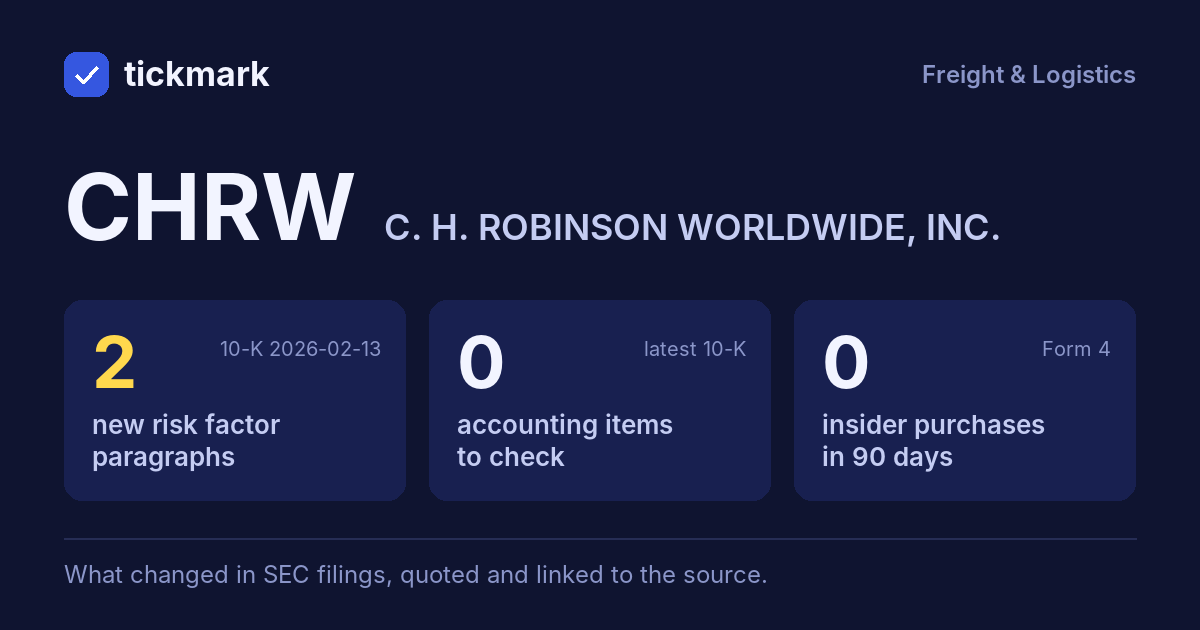
Sentences and paragraphs of CHRW's Risk Factors and MD&A, 10-K 2026-02-13 against 10-K 2025-02-14.
Each links to the text at sec.gov.
AddedRisk Factors
The industry is undergoing rapid technological change, including the emergence of disruptive technologies and accelerated adoption of automation and AI. Competitors are leveraging advanced digital platforms, AI-driven freight matching, and automation to improve efficiency and reduce costs. If we fail to maintain the pace, scale, or quality of automation and AI adoption, we may be unable to achieve our strategic goals for operational efficiency and digital transformation. Inability to keep up with these advancements could increase our cost to serve customers, reduce productivity and negatively impact our ability to compete. Delays in implementing new systems or integrating emerging technologies into our workflows may also lead to higher operating expenses and missed opportunities for growth. If we cannot effectively respond to competitive pressures and technological disruption, our business, financial condition, and results of operations could be materially and adversely affected.
Read it in 10-K 2026-02-13 at sec.gov ↗
AddedRisk Factors
•changes in tariffs, trade restrictions, trade agreements, and taxations. In 2025, the United States government made significant changes to our national trade policy, including imposing tariffs on certain goods imported into the United States. The tariffs impacted our Global Forwarding business in 2025, most significantly in the second quarter of 2025, with volatile market conditions causing global demand fluctuations and lower volumes. Changes in United States trade policy, including tariffs on certain imported goods, could continue to increase our costs and disrupt global supply chains. These actions, and any retaliatory measures by other countries, may lead to higher transportation costs and reduced demand, resulting in potential loss of freight volume. Additionally, heightened customs requirements could delay shipments and require significant internal resources, increasing operating expenses and negatively impacting our ability to serve customers efficiently. If we cannot mitigate these challenges, our business, financial condition, and results of operations could be materially affected;
Read it in 10-K 2026-02-13 at sec.gov ↗
AddedMD&A
Carrier capacity in the North America surface transportation market continued to contract toward the end of 2025 as carriers exited the market. This gradual tightening, coupled with disruptive weather events and incremental pressures from the enforcement of commercial driver regulations, contributed to upward pressure on transportation rates. As a result, the market has become increasingly sensitive, with spot market rates exhibiting sharper than typical reactions to changes in supply and demand conditions. Despite these emerging pressures, the market has not fully transitioned into a sustained upcycle. Key indicators, such as truckload routing guide depth within our Managed Solutions business, have remained at historically low levels for nearly two years. Routing guide depth represents the average number of carriers contacted prior to acceptance when procuring a transportation provider. Average routing guide depth was 1.3 in the fourth quarter of 2025, compared to 1.2 for much of the prior two years. While this increase reflects early signs of a tightening market, soft demand conditions and remaining excess capacity continue to temper the pace of the shift.
Read it in 10-K 2026-02-13 at sec.gov ↗
AddedMD&A
The global forwarding market continued to face a persistent imbalance in 2025, marked by excess vessel capacity and weak global demand. Despite carriers’ ongoing avoidance of the Suez Canal, which has resulted in longer transit times and strain on global networks, vessel capacity has remained elevated. While short periods of rate volatility have occurred due to shifting trade and tariff policies, front‑loading, seasonal factors, and carriers’ use of blank sailings, international freight rates have largely remained depressed as weak demand outweighed these pressures. Looking ahead, uncertainty persists due to geopolitical and macroeconomic factors, including evolving trade policies, the Red Sea conflict, and carriers’ ability to effectively manage excess capacity. Despite this uncertainty, we expect ocean pricing to remain under pressure until global freight demand meaningfully improves. Similar dynamics continue to affect the air freight market. Although demand has shown resilience in certain technology‑focused sectors, overall air freight pricing remains sensitive to tariff developments and broader economic conditions, including cost-efficient ocean freight rates.
Read it in 10-K 2026-02-13 at sec.gov ↗
AddedMD&A
Our surface transportation results in 2025 reflected the challenging market conditions described above, including the increase in transportation rates as capacity tightened in the market near the end of the year. Throughout the year, we continued to advance our dynamic pricing and costing capabilities, navigating both the prolonged softness in demand and the rising cost environment that emerged toward year‑end. These enhanced capabilities allowed us to better react to changing market conditions and led to an improvement in adjusted gross profit per transaction in 2025 compared to 2024. Our average truckload linehaul rate charged to customers, excluding fuel surcharges, increased approximately 2.5 percent during 2025 reflecting our advanced dynamic pricing. Our average truckload linehaul cost per mile, excluding fuel surcharges, increased approximately 2.0 percent over the same period, reflecting our disciplined costing capabilities. Despite operating in a persistently soft market for much of the year, our combined North American Surface Transportation (“NAST”) truckload and LTL volumes significantly outperformed the Cass Freight Index increasing 1.0 percent compared to 2024.
Read it in 10-K 2026-02-13 at sec.gov ↗
AddedMD&A
Total revenues and direct costs. Total revenues and direct costs decreased primarily due to the divestiture of our Europe Surface Transportation business, as well as lower pricing and volume in our ocean services and lower fuel surcharges in our truckload services. During 2024, ocean transportation revenues and direct costs were elevated as a result of ongoing disruptions, including the Red Sea conflict, which strained capacity and increased ocean freight rates. While short periods of rate volatility occurred during 2025, driven by shifting trade policies, front-loading, seasonal factors, and carriers’ use of blank sailings, overall ocean freight rates have largely remained depressed as weak demand outweighed these pressures. Our sourcing total revenue and direct costs increased, driven by increased case volume with retail and foodservice customers.
Read it in 10-K 2026-02-13 at sec.gov ↗
AddedMD&A
Gross profits and adjusted gross profits. Our transportation adjusted gross profits decreased due to lower adjusted gross profit per transaction in our ocean services and the divestiture of our Europe Surface Transportation business. These impacts were partially offset by increased adjusted gross profit per transaction in our LTL, truckload, and customs services. The decline in ocean services was largely attributable to the significant reduction in market pricing during 2025, compared to the same period in 2024 discussed above. Conversely, the increase in adjusted gross profit per transaction in LTL and truckload services reflects the continued advancement of our dynamic pricing and costing capabilities. These advancements have allowed us to respond more rapidly to market fluctuations through more frequent and precise pricing discovery. Sourcing adjusted gross profits increased, driven by an increase in integrated supply chain solutions for foodservice and retail customers.
Read it in 10-K 2026-02-13 at sec.gov ↗
AddedMD&A
Gross profits and adjusted gross profits. NAST adjusted gross profits increased driven by higher adjusted gross profits per transaction in both truckload and LTL services. The improvement was driven by the continued advancement of our dynamic pricing and costing capabilities. These advancements have allowed us to respond more rapidly to market fluctuations through more frequent and precise pricing discovery. NAST other adjusted gross profits decreased, primarily due to a decrease in warehousing services.
Read it in 10-K 2026-02-13 at sec.gov ↗
Show the other 4
AddedMD&A
Operating expenses. NAST personnel expenses decreased driven by cost optimization efforts and productivity improvements, including lower average headcount. NAST other SG&A expenses were flat as higher allocated corporate expenses were offset by lower expenditures on purchased services, including contingent worker expenses, and lower occupancy expense.
Read it in 10-K 2026-02-13 at sec.gov ↗
AddedMD&A
Gross profits and adjusted gross profits. Global Forwarding adjusted gross profits decreased driven by lower adjusted gross profit per shipment and lower volumes in ocean services. The decline in adjusted gross profit per shipment in ocean services reflected the significant reduction in market pricing during 2025 compared to the same period in 2024, as discussed above. Partially offsetting the decline, customs adjusted gross profits increased, driven by higher duty advance fees reflecting elevated global tariff rates in 2025.
Read it in 10-K 2026-02-13 at sec.gov ↗
AddedMD&A
The sale of our Europe Surface Transportation business closed effective February 1, 2025. We received $27.7 million of consideration at closing with additional fixed installment payments due throughout 2026. The remaining consideration due is collateralized by all current and future accounts receivable of the Europe Surface Transportation business.
Read it in 10-K 2026-02-13 at sec.gov ↗
AddedMD&A
We may seek to retire or purchase our outstanding Senior Notes through open market cash purchases, privately negotiated transactions, or otherwise.
Read it in 10-K 2026-02-13 at sec.gov ↗