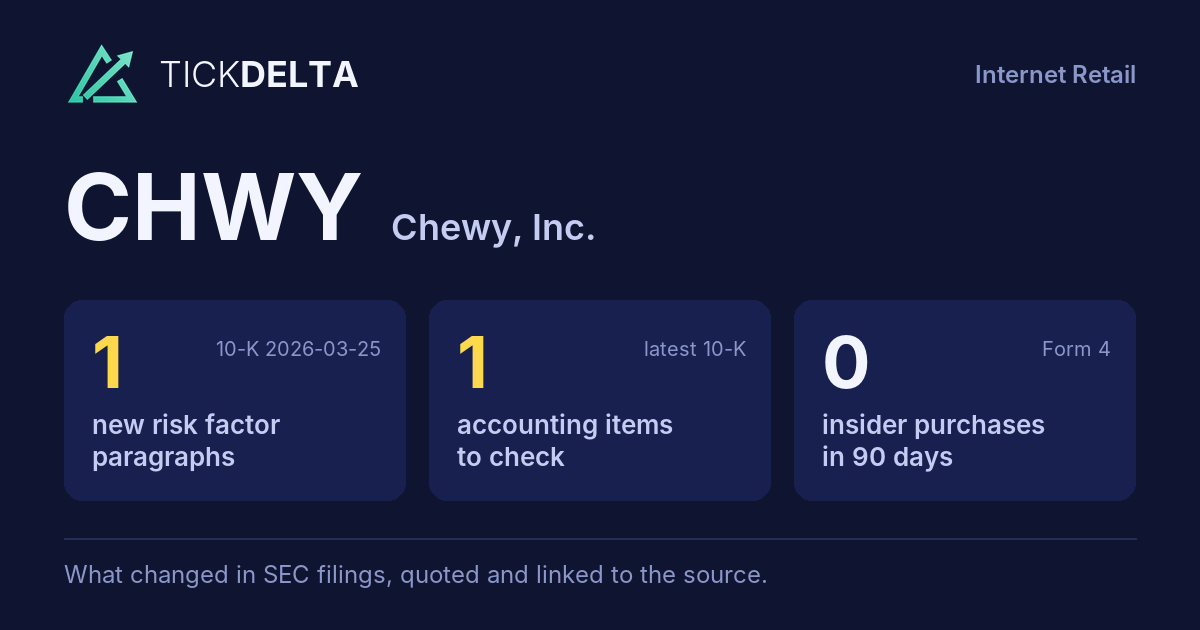
Screener / SEC EDGAR /CIK 0001766502 /10-K filed Mar 25, 2026, compared with Mar 26, 2025 /Numbers from the XBRL of the 10-Ks
NYSE Consumer discretionary · Internet Retail

Chewy, Inc. CHWY

Compare with peers Embed
Earnings releases

Latest results release: Sep 9, 2026

8-K item 2.02, exhibit 99

What CHWY's management wrote with each quarter's results: the press release and, when the company files them, its prepared remarks or the call transcript. The call itself is not filed with SEC, so most quarters have the release only.

Adjusted vs GAAP earnings per share

In the company's own words · read from each release, never computed

In its release of Dec 6, 2023, CHWY reported −$0.08 per share under GAAP and $0.15 on its own adjusted basis.

ReleaseGAAP EPSAdjusted EPSGap
Dec 6, 2023 -0.08 0.15 –
The company's words, latest release
% 2.8 % 3.4 % 2.9 % Adjusted net income (3) $ 63,011 $ 48,401 30.2 % $ 213,576 $ 156,151 36.8 % (Loss) earnings per share, basic and diluted (1) $ (0.08) $ 0.01 n/m $ 0.01 $ 0.10 (90.0) % Adjus release
36.8 % (Loss) earnings per share, basic and diluted (1) $ (0.08) $ 0.01 n/m $ 0.01 $ 0.10 (90.0) % Adjusted earnings per share, basic and diluted (3) $ 0.15 $ 0.11 36.4 % $ 0.50 $ 0.37 35.1 % Net release

What the company says its adjusted numbers leave out:

Adjusted net income and Adjusted earnings per share exclude certain non-cash and non-recurring items, including share-based compensation and related taxes, releases of valuation allowances associated with deferred tax assets, transaction-related costs, net legal settlement proceeds, changes in the fair value of equity warrants, and severance and exit costs. release Sep 9, 2026

Both numbers are read from the words of each release (usually the highlights), never computed by us; hover a number for its sentence. Quarters where the release gives them only in a table are not shown. The company decides what "adjusted" leaves out; the full reconciliation is in the release.

Read and search

Every release, in full · linked to sec.gov

Press release Sep 9, 2026 · EX-99.1

Chewy Announces Second Quarter 2026 Financial Results

Open on SEC

PLANTATION, Fla., September 9, 2026 (BUSINESS WIRE) — Chewy, Inc. (NYSE: CHWY) (“Chewy”), a trusted destination for pet parents and partners everywhere, has released its financial results for the second quarter of fiscal year 2026 ended August 2, 2026.

Fiscal Q2 2026 Highlights: • Net sales of $3.33 billion increased 7.3 percent year over year or 5.7 percent excluding SmartPak and Modern Animal contributions

• Net income of $80.5 million, including share-based compensation expense and related taxes of $85.9 million

• Adjusted EBITDA (1) of $226.7 million, an increase of $43.4 million year over year

• Adjusted EBITDA margin (1) of 6.8 percent increased 90 basis points year over year

• Adjusted net income (1) of $148.8 million, an increase of $7.7 million year over year

• Adjusted basic earnings per share (1) of $0.37, an increase of $0.03 year over year

• Adjusted diluted earnings per share (1) of $0.36, an increase of $0.03 year over year

“Chewy delivered a strong second quarter, with growth of 7.3% to $3.33 billion of net sales at the high end of our guidance, and a 6.8% Adj. EBITDA margin, exceeding our expectations,” said Sumit Singh, Chief Executive Officer of Chewy. “The durability of our recurring revenue base, continued customer growth, and disciplined execution give us confidence to raise our full-year revenue and profitability outlook, while continuing to invest in compelling opportunities that deepen customer engagement and create long-term shareholder value.” Management will host a conference call and webcast to discuss Chewy's financial results today at 8:00 am ET.

(1) Adjusted EBITDA, adjusted EBITDA margin, adjusted net income, and adjusted basic and diluted earnings per share are non-GAAP financial measures. See “Non- GAAP Financial Measures” for additional information on non-GAAP financial measures and a reconciliation to the most comparable GAAP measures.

Our mission is to be the most trusted and convenient destination for pet parents and partners everywhere. We believe that we are the preeminent online source for pet products, supplies, and prescriptions as a result of our broad selection of high-quality products and services, which we offer at competitive prices and deliver with an exceptional level of care and a personal touch to build brand loyalty and drive repeat purchasing. We seek to continually develop innovative ways for our customers to engage with us, as our websites and mobile applications allow our pet parents to manage their pets’ health, wellness, and merchandise needs, while enabling them to conveniently shop for our products. We partner with approximately 4,000 of the best and most trusted brands in the pet industry, and we create and offer our own private brands. Through our websites and mobile applications, we offer our customers approximately 190,000 products and services offerings, to bring what we believe is a high-bar, customer-centric experience to our customers.

This communication contains forward-looking statements about us and our industry that involve substantial risks and uncertainties. All statements other than statements of historical facts contained in this communication, including statements regarding our share repurchase program, our future results of operations or financial condition, business strategy and plans and objectives of management for future operations, are forward-looking statements. In some cases, you can identify forward-looking statements because they contain words such as “anticipate,” “believe,” “contemplate,” “continue,” “could,” “estimate,” “expect,” “forecast,” “intend,” “may,” “plan,” “potential,” “predict,” “project,” “seek,” “should,” “target,” “will” or “would” or the negative of these words or other similar terms or expressions, although not all forward- looking statements contain these identifying words.

Although we believe that these forward-looking statements are based on reasonable assumptions, you should be aware that many factors could cause actual results to differ materially from those in such forward-looking statements, including but not limited to, our ability to: sustain our recent growth rates and successfully manage challenges to our future growth, including introducing new products or services, improving existing products and services, and expanding into new jurisdictions and offerings; successfully respond to business disruptions; successfully manage risks related to the macroeconomic environment, including any adverse impacts on our business operations, financial performance, supply chain, workforce, facilities, customer services and operations; acquire and retain new customers in a cost-effective manner and increase our net sales, improve margins and maintain profitability; manage our growth effectively; maintain positive perceptions of the Company and preserve, grow, and leverage the value of our reputation and our brand; limit operating losses as we continue to expand our business; forecast net sales and appropriately plan our expenses in the future; estimate our market share; strengthen our current supplier relationships, retain key suppliers, and source additional suppliers; negotiate acceptable pricing and other terms with third-party service providers, suppliers and outsourcing partners and maintain our relationships with such parties; mitigate changes in, or disruptions to, our shipping arrangements and operations; optimize, operate and manage the expansion of the capacity of our fulfillment centers; provide our customers with a cost-effective platform that is able to respond and adapt to rapid changes in technology; limit our losses related to online payment methods; maintain and scale our technology, the reliability of our websites, mobile applications, and network infrastructure, including through the use of artificial intelligence; maintain adequate cybersecurity with respect to our systems and retain third-party service providers that do the same with respect to their systems; maintain consumer confidence in the safety, quality and health of our products; limit risks associated with our suppliers and our outsourcing partners; comply with existing or future laws and regulations in a cost-efficient manner; utilize net operating loss and tax credit carryforwards, and other tax attributes; adequately protect our intellectual property rights; successfully defend ourselves against any allegations or claims that we may be subject to; attract, develop, motivate and retain highly-qualified and skilled employees; respond to economic conditions, industry trends, and market conditions, and their impact on the pet products market; reduce merchandise returns or refunds; respond to severe weather and limit disruption to normal business operations; manage new acquisitions, investments or alliances, and integrate them into our existing business; successfully compete in new offerings; manage challenges presented by international markets; successfully compete in the pet products and services health and retail industry, especially in the e-commerce sector; comply with the terms of our credit facility; raise capital as needed; and maintain effective internal control over financial reporting.

You should not rely on forward-looking statements as predictions of future events, and you should understand that these statements are not guarantees of performance or results, and our actual results could differ materially from those expressed in the forward-looking statements due to a variety of factors. We have based the forward-looking statements contained in this communication primarily on our current assumptions, expectations, and projections about future events and trends that we believe may affect our business, financial condition, and results of operations. The outcome of the events described in these forward- looking statements is subject to risks, uncertainties and other factors described in the section titled “Risk Factors” included under Part 1, Item 1A in our Annual Report on Form 10-K for the fiscal year ended February 1, 2026, in our other filings with the Securities and Exchange Commission, our subsequent quarterly reports, and elsewhere in this communication. Moreover, we operate in a very competitive and rapidly changing environment. New risks and uncertainties emerge from time to time, and it is not possible for us to predict all risks and uncertainties that could have an impact on the forward-looking statements contained in this communication. The results, events and circumstances reflected in the forward-looking statements may not be achieved or occur, and actual results, events or circumstances could differ materially from those described in the forward-looking statements. In addition, statements that “we believe” and similar statements reflect our beliefs and opinions on the relevant subject. These statements are based on information available to us as of the date of this communication. While we believe that such information provides a reasonable basis for these statements, this information may be limited or incomplete. Our statements should not be read to indicate that we have conducted an exhaustive inquiry into, or review of, all relevant information. These statements are inherently uncertain, and investors are cautioned not to unduly rely on these statements. The forward-looking statements made in this communication relate only to events as of the date on which the statements are made. We undertake no obligation to update any forward-looking statements made in this communication to reflect events or circumstances after the date of this communication or to reflect new information or the occurrence of unanticipated events, except as required by law. We may not actually achieve the plans, intentions or expectations disclosed in our forward-looking statements, and you should not place undue reliance on our forward-looking statements. Our forward-looking statements do not reflect the potential impact of any future acquisitions, mergers, dispositions, joint ventures or investments.

August 2, February 1, As of 2026 2026 ────────────────────────────────────────────────────────────────────────────── Assets -Unaudited Current assets: Cash and cash equivalents $ 611.0 $ 860.1 Marketable securities 1.2 18.7 Accounts receivable 232.1 222.2 Inventories 924.7 864.8 Prepaid expenses and other current 76.3 70.0 assets Total current assets 1,845.3 2,035.8 Property and equipment, net 624.8 552.3 Intangible assets, net 149.7 0.3 Operating lease right-of-use 482.1 467.9 assets Goodwill 334.1 39.4 Deferred tax assets 264.7 232.2 Other non-current assets 39.9 38.5 Total assets $ 3,740.6 $ 3,366.4 Liabilities and stockholders’ equity Current liabilities: Trade accounts payable $ 1,166.0 $ 1,221.4 Accrued expenses and other current 1,033.4 1,080.2 liabilities Current portion of long-term debt 3.0 — Total current liabilities 2,202.4 2,301.6 Operating lease liabilities 527.2 518.7 Long-term debt, net 588.7 — Other long-term liabilities 51.8 48.2 Total liabilities 3,370.1 2,868.5 Stockholders’ equity: Preferred stock, $0.01 par value per share, 5,000,000 shares authorized, no — — shares issued and outstanding as of August 2, 2026 and February 1, 2026 Class A common stock, $0.01 par value per share, 1,500,000,000 shares authorized, 224,993,295 and 238,647,144 2.2 2.4 shares issued and outstanding as of August 2, 2026 and February 1, 2026, respectively Class B common stock, $0.01 par value per share, 395,000,000 shares authorized, 176,478,229 and 176,478,229 1.8 1.8 shares issued and outstanding as of August 2, 2026 and February 1, 2026, respectively Additional paid-in capital 1,550.7 1,852.9 Accumulated deficit -1,184.8 -1,360.1 Accumulated other comprehensive 0.6 0.9 income Total stockholders’ equity 370.5 497.9 Total liabilities and stockholders’ $ 3,740.6 $ 3,366.4 equity

August 2, August 3, 26 Weeks Ended 2026 2025 ────────────────────────────────────────────────────────────────────────────── Cash flows from operating activities Net income $ 175.3 $ 124.4 Adjustments to reconcile net income to net cash provided by operating activities: Depreciation and amortization 76.7 62.1 Share-based compensation 150.4 150.4 expense Non-cash lease expense 19.6 17.4 Unrealized foreign currency (gains) — -0.2 losses, net Other adjustments 6.8 5.8 Net change in operating assets and liabilities: Accounts receivable -8.2 -52.1 Inventories -44.9 -37.5 Prepaid expenses and other current -2.7 -32.2 assets Other non-current assets -0.4 — Trade accounts payable -65.3 50.0 Accrued expenses and other current -49.3 -49.8 liabilities Operating lease liabilities -18.5 -16.9 Other long-term liabilities 6.4 -1.1 Net cash provided by operating 245.9 220.3 activities Cash flows from investing activities Capital expenditures -85.6 -65.7 Purchases of marketable -21.4 — securities Proceeds from maturities of marketable 39.2 — securities Cash paid for acquisition of businesses, -552.8 — net of cash acquired Other investing activities — -5.2 Net cash (used in) investing -620.6 -70.9 activities Cash flows from financing activities Repurchases of common stock -400.0 -152.6 Proceeds from, net of income taxes paid 4.3 2.3 for, parent reorganization transaction Repayment of borrowings and related — -0.8 financing costs Proceeds from debt 811.7 — Principal repayments of debt -220.0 — Payments for tax withholdings related to vesting of share-based -68.7 — compensation awards Other -1.4 -2.9 Net cash provided by (used in) financing 125.9 -154.0 activities Effect of exchange rate changes on cash -0.3 0.6 and cash equivalents Net (decrease) in cash and cash -249.1 -4.0 equivalents Cash and cash equivalents, as of 860.1 595.8 beginning of period Cash and cash equivalents, as of end of $ 611.0 $ 591.8 period

To supplement our GAAP results, we present certain non-GAAP financial measures that management uses to evaluate operating performance, assess liquidity, and inform capital allocation decisions. These measures include Adjusted EBITDA and Adjusted EBITDA margin, Adjusted net income and Adjusted earnings per share, and Free cash flow. Adjusted EBITDA excludes depreciation and amortization, share-based compensation and related taxes, income tax provision (benefit), interest income (expense), transaction-related costs, net legal settlement proceeds, changes in the fair value of equity warrants, severance and exit costs, and other items not considered indicative of our core operations. Adjusted EBITDA margin represents Adjusted EBITDA as a percentage of net sales.

Adjusted net income and Adjusted earnings per share exclude certain non-cash and non-recurring items, including share-based compensation and related taxes, releases of valuation allowances associated with deferred tax assets, transaction-related costs, net legal settlement proceeds, changes in the fair value of equity warrants, and severance and exit costs. Beginning in the first quarter of 2026, Adjusted net income excludes transaction-related costs prospectively.

Free cash flow represents net cash provided by operating activities less capital expenditures.

We believe these measures provide additional insight into the underlying trends in our business and facilitate comparisons across reporting periods. Reconciliations to the most directly comparable GAAP measures are provided below.

These non-GAAP measures have limitations and should not be considered in isolation or as a substitute for GAAP results. For example, Adjusted EBITDA does not reflect capital expenditures, working capital requirements, interest income (expense), income taxes, or share-based compensation, which remains a recurring component of our compensation structure. In addition, other companies may calculate non-GAAP measures differently, which may limit their comparability. Accordingly, these measures should be considered together with our GAAP financial statements and related disclosures.

We measure our business using both financial and operating data and use the following metrics and measures to assess the near-term and long-term performance of our overall business, including identifying trends, formulating financial projections, making strategic decisions, assessing operational efficiencies, and monitoring our business.

We define net margin as net income divided by net sales and adjusted EBITDA margin as adjusted EBITDA divided by net sales.

The following table presents a reconciliation of net income to adjusted EBITDA, as well as the calculation of net margin and adjusted EBITDA margin, for each of the periods indicated:

Adjusted Net Income and Adjusted Basic and Diluted Earnings per Share The following table presents a reconciliation of net income to adjusted net income, as well as the calculation of adjusted basic and diluted earnings per share, for each of the periods indicated:

The following table presents a reconciliation of net cash provided by operating activities to free cash flow for each of the periods indicated:

Free cash flow may vary period to period based on the timing and level of capital expenditures, including investments in fulfillment capacity, pharmacy facilities, veterinary clinics, technology infrastructure, and other operational initiatives. Free cash flow may also be affected by changes in working capital, including fluctuations in inventory levels, vendor payment terms, and other components of the cash conversion cycle. Investor Contact:

Full text with the tables
                                                                                
             Chewy Announces Second Quarter 2026 Financial Results              
                                                                                
PLANTATION, Fla., September 9, 2026 (BUSINESS WIRE) — Chewy, Inc. (NYSE: CHWY)
(“Chewy”), a trusted destination for pet parents and partners everywhere, has
released its financial results for the second quarter of fiscal year 2026 ended
August 2, 2026.

Fiscal Q2 2026 Highlights:
• Net sales of $3.33 billion increased 7.3 percent year over year or 5.7 percent
excluding SmartPak and Modern Animal contributions

• Gross margin of 30.4 percent stayed consistent year over year

• Net income of $80.5 million, including share-based compensation expense and
related taxes of $85.9 million

• Net margin of 2.4 percent increased 40 basis points year over year

• Basic earnings per share of $0.20, an increase of $0.05 year over year

• Diluted earnings per share of $0.20, an increase of $0.06 year over year

• Adjusted EBITDA (1) of $226.7 million, an increase of $43.4 million year over
year

• Adjusted EBITDA margin (1) of 6.8 percent increased 90 basis points year over
year

• Adjusted net income (1) of $148.8 million, an increase of $7.7 million year
over year

• Adjusted basic earnings per share (1) of $0.37, an increase of $0.03 year over
year

• Adjusted diluted earnings per share (1) of $0.36, an increase of $0.03 year
over year

“Chewy delivered a strong second quarter, with growth of 7.3% to $3.33 billion
of net sales at the high end of our guidance, and a 6.8% Adj. EBITDA margin,
exceeding our expectations,” said Sumit Singh, Chief Executive Officer of Chewy.
“The durability of our recurring revenue base, continued customer growth, and
disciplined execution give us confidence to raise our full-year revenue and
profitability outlook, while continuing to invest in compelling opportunities
that deepen customer engagement and create long-term shareholder value.”
Management will host a conference call and webcast to discuss Chewy's financial
results today at 8:00 am ET.

Chewy Fiscal Second Quarter 2026 Financial Results Conference Call

When: Wednesday, September 9, 2026

Time: 8:00 am ET

Live webcast and replay: https://investor.chewy.com

Conference call registration: https://events.q4inc.com/attendee/640129598

(1) Adjusted EBITDA, adjusted EBITDA margin, adjusted net income, and adjusted
basic and diluted earnings per share are non-GAAP financial measures. See “Non-
GAAP Financial Measures” for additional information on non-GAAP financial
measures and a reconciliation to the most comparable GAAP measures.
                                                                                
  About Chewy                                                                   
                                                                                
Our mission is to be the most trusted and convenient destination for pet parents
and partners everywhere. We believe that we are the preeminent online source for
pet products, supplies, and prescriptions as a result of our broad selection of
high-quality products and services, which we offer at competitive prices and
deliver with an exceptional level of care and a personal touch to build brand
loyalty and drive repeat purchasing. We seek to continually develop innovative
ways for our customers to engage with us, as our websites and mobile
applications allow our pet parents to manage their pets’ health, wellness, and
merchandise needs, while enabling them to conveniently shop for our products. We
partner with approximately 4,000 of the best and most trusted brands in the pet
industry, and we create and offer our own private brands. Through our websites
and mobile applications, we offer our customers approximately 190,000 products
and services offerings, to bring what we believe is a high-bar, customer-centric
experience to our customers.
                                                                                
  Forward-Looking Statements                                                    
                                                                                
This communication contains forward-looking statements about us and our industry
that involve substantial risks and uncertainties. All statements other than
statements of historical facts contained in this communication, including
statements regarding our share repurchase program, our future results of
operations or financial condition, business strategy and plans and objectives of
management for future operations, are forward-looking statements. In some cases,
you can identify forward-looking statements because they contain words such as
“anticipate,” “believe,” “contemplate,” “continue,” “could,” “estimate,”
“expect,” “forecast,” “intend,” “may,” “plan,” “potential,” “predict,”
“project,” “seek,” “should,” “target,” “will” or “would” or the negative of
these words or other similar terms or expressions, although not all forward-
looking statements contain these identifying words.

Although we believe that these forward-looking statements are based on
reasonable assumptions, you should be aware that many factors could cause actual
results to differ materially from those in such forward-looking statements,
including but not limited to, our ability to: sustain our recent growth rates
and successfully manage challenges to our future growth, including introducing
new products or services, improving existing products and services, and
expanding into new jurisdictions and offerings; successfully respond to business
disruptions; successfully manage risks related to the macroeconomic environment,
including any adverse impacts on our business operations, financial performance,
supply chain, workforce, facilities, customer services and operations; acquire
and retain new customers in a cost-effective manner and increase our net sales,
improve margins and maintain profitability; manage our growth effectively;
maintain positive perceptions of the Company and preserve, grow, and leverage
the value of our reputation and our brand; limit operating losses as we continue
to expand our business; forecast net sales and appropriately plan our expenses
in the future; estimate our market share; strengthen our current supplier
relationships, retain key suppliers, and source additional suppliers; negotiate
acceptable pricing and other terms with third-party service providers, suppliers
and outsourcing partners and maintain our relationships with such parties;
mitigate changes in, or disruptions to, our shipping arrangements and
operations; optimize, operate and manage the expansion of the capacity of our
fulfillment centers; provide our customers with a cost-effective platform that
is able to respond and adapt to rapid changes in technology; limit our losses
related to online payment methods; maintain and scale our technology, the
reliability of our websites, mobile applications, and network infrastructure,
including through the use of artificial intelligence; maintain adequate
cybersecurity with respect to our systems and retain third-party service
providers that do the same with respect to their systems; maintain consumer
confidence in the safety, quality and health of our products; limit risks
associated with our suppliers and our outsourcing partners; comply with existing
or future laws and regulations in a cost-efficient manner; utilize net operating
loss and tax credit carryforwards, and other tax attributes; adequately protect
our intellectual property rights; successfully defend ourselves against any
allegations or claims that we may be subject to; attract, develop, motivate and
retain highly-qualified and skilled employees; respond to economic conditions,
industry trends, and market conditions, and their impact on the pet products
market; reduce merchandise returns or refunds; respond to severe weather and
limit disruption to normal business operations; manage new acquisitions,
investments or alliances, and integrate them into our existing business;
successfully compete in new offerings; manage challenges presented by
international markets; successfully compete in the pet products and services
health and retail industry, especially in the e-commerce sector; comply with the
terms of our credit facility; raise capital as needed; and maintain effective
internal control over financial reporting.

You should not rely on forward-looking statements as predictions of future
events, and you should understand that these statements are not guarantees of
performance or results, and our actual results could differ materially from
those expressed in the forward-looking statements due to a variety of factors.
We have based the forward-looking statements contained in this communication
primarily on our current assumptions, expectations, and projections about future
events and trends that we believe may affect our business, financial condition,
and results of operations. The outcome of the events described in these forward-
looking statements is subject to risks, uncertainties and other factors
described in the section titled “Risk Factors” included under Part 1, Item 1A in
our Annual Report on Form 10-K for the fiscal year ended February 1, 2026, in
our other filings with the Securities and Exchange Commission, our subsequent
quarterly reports, and elsewhere in this communication. Moreover, we operate in
a very competitive and rapidly changing environment. New risks and uncertainties
emerge from time to time, and it is not possible for us to predict all risks and
uncertainties that could have an impact on the forward-looking statements
contained in this communication. The results, events and circumstances reflected
in the forward-looking statements may not be achieved or occur, and actual
results, events or circumstances could differ materially from those described in
the forward-looking statements. In addition, statements that “we believe” and
similar statements reflect our beliefs and opinions on the relevant subject.
These statements are based on information available to us as of the date of this
communication. While we believe that such information provides a reasonable
basis for these statements, this information may be limited or incomplete. Our
statements should not be read to indicate that we have conducted an exhaustive
inquiry into, or review of, all relevant information. These statements are
inherently uncertain, and investors are cautioned not to unduly rely on these
statements. The forward-looking statements made in this communication relate
only to events as of the date on which the statements are made. We undertake no
obligation to update any forward-looking statements made in this communication
to reflect events or circumstances after the date of this communication or to
reflect new information or the occurrence of unanticipated events, except as
required by law. We may not actually achieve the plans, intentions or
expectations disclosed in our forward-looking statements, and you should not
place undue reliance on our forward-looking statements. Our forward-looking
statements do not reflect the potential impact of any future acquisitions,
mergers, dispositions, joint ventures or investments.
                                                                                
                                  CHEWY, INC.                                   
                                                                                
                                                                                
                     CONDENSED CONSOLIDATED BALANCE SHEETS                      
                                                                                
                 (in millions, except share and per share data)                 
                                                                                
                                                   August 2,       February 1,  
                                       As of            2026              2026  
 ────────────────────────────────────────────────────────────────────────────── 
  Assets                               -Unaudited                               
  Current assets:                                                               
  Cash and cash equivalents            $               611.0    $        860.1  
  Marketable securities                                  1.2              18.7  
  Accounts receivable                                  232.1             222.2  
  Inventories                                          924.7             864.8  
  Prepaid expenses and other                                                    
  current                                               76.3              70.0  
  assets                                                                        
  Total current assets                               1,845.3           2,035.8  
  Property and equipment, net                          624.8             552.3  
  Intangible assets, net                               149.7               0.3  
  Operating lease right-of-use                         482.1             467.9  
  assets                                                                        
  Goodwill                                             334.1              39.4  
  Deferred tax assets                                  264.7             232.2  
  Other non-current assets                              39.9              38.5  
  Total assets                         $             3,740.6    $      3,366.4  
  Liabilities and stockholders’                                                 
  equity                                                                        
  Current liabilities:                                                          
  Trade accounts payable               $             1,166.0    $      1,221.4  
  Accrued expenses and other                                                    
  current                                            1,033.4           1,080.2  
  liabilities                                                                   
  Current portion of long-term debt                      3.0                 —  
  Total current liabilities                          2,202.4           2,301.6  
  Operating lease liabilities                          527.2             518.7  
  Long-term debt, net                                  588.7                 —  
  Other long-term liabilities                           51.8              48.2  
  Total liabilities                                  3,370.1           2,868.5  
  Stockholders’ equity:                                                         
  Preferred stock, $0.01 par value                                              
  per                                                                           
  share, 5,000,000 shares                                                       
  authorized, no                                           —                 —  
  shares issued and outstanding as                                              
  of                                                                            
  August 2, 2026 and February 1,                                                
  2026                                                                          
  Class A common stock, $0.01 par                                               
  value                                                                         
  per share, 1,500,000,000 shares                                               
  authorized, 224,993,295 and                                                   
  238,647,144                                            2.2               2.4  
  shares issued and outstanding as                                              
  of                                                                            
  August 2, 2026 and February 1,                                                
  2026,                                                                         
  respectively                                                                  
  Class B common stock, $0.01 par                                               
  value                                                                         
  per share, 395,000,000 shares                                                 
  authorized, 176,478,229 and                                                   
  176,478,229                                            1.8               1.8  
  shares issued and outstanding as                                              
  of                                                                            
  August 2, 2026 and February 1,                                                
  2026,                                                                         
  respectively                                                                  
  Additional paid-in capital                         1,550.7           1,852.9  
  Accumulated deficit                               -1,184.8          -1,360.1  
  Accumulated other comprehensive                        0.6               0.9  
  income                                                                        
  Total stockholders’ equity                           370.5             497.9  
  Total liabilities and                                                         
  stockholders’                        $             3,740.6    $      3,366.4  
  equity                                                                        
                                                                                
                                                                                
                                  CHEWY, INC.                                   
                                                                                
                                                                                
    CONDENSED CONSOLIDATED STATEMENTS OF OPERATIONS AND COMPREHENSIVE INCOME    
                                                                                
                      (in millions, except per share data)                      
                                                                                
                                  (Unaudited)                                   
                                                                                
            13        August        August               August         August  
            Weeks         2,            3,    26 Weeks       2,             3,  
            Ended       2026          2025    Ended        2026           2025  
 ────────────────────────────────────────────────────────────────────────────── 
  Net       $        3,330.2    $  3,104.2    $         6,687.4    $   6,220.2  
  sales                                                                         
  Cost                                                                          
  of                 2,319.0       2,162.0              4,664.8        4,354.2  
  goods                                                                         
  sold                                                                          
  Gross              1,011.2         942.2              2,022.6        1,866.0  
  profit                                                                        
  Opera…                                                                        
  expen…                                                                        
  Selli…                                                                        
  gener…               704.4         671.9              1,381.2        1,325.0  
  and                                                                           
  admin…                                                                        
  Adver…                                                                        
  and                  214.8         200.6                420.9          394.4  
  marke…                                                                        
  Total                                                                         
  opera…               919.2         872.5              1,802.1        1,719.4  
  expen…                                                                        
  Income                                                                        
  from                  92.0          69.7                220.5          146.6  
  opera…                                                                        
  Inter…                                                                        
  and                                                                           
  other                 19.9           4.3                 22.7            5.3  
  incom…                                                                        
  net                                                                           
  Income                                                                        
  before                                                                        
  income               111.9          74.0                243.2          151.9  
  tax                                                                           
  provi…                                                                        
  Income                                                                        
  tax                   31.4          12.0                 67.9           27.5  
  provi…                                                                        
  Net       $           80.5    $     62.0    $           175.3    $     124.4  
  income                                                                        
  Compr…                                                                        
  incom…                                                                        
  Net       $           80.5    $     62.0    $           175.3    $     124.4  
  income                                                                        
  Forei…                                                                        
  curre…                -0.3           0.2                 -0.3            0.6  
  trans…                                                                        
  adjus…                                                                        
  Compr…    $           80.2    $     62.2    $           175.0    $     125.0  
  income                                                                        
  Earni…                                                                        
  per                                                                           
  share                                                                         
  attri…                                                                        
  to                                                                            
  common                                                                        
  Class                                                                         
  A and                                                                         
  Class                                                                         
  B                                                                             
  stock…                                                                        
  Basic     $           0.20    $     0.15    $            0.43    $      0.30  
  Dilut…    $           0.20    $     0.14    $            0.42    $      0.29  
  Weigh…                                                                        
  common                                                                        
  shares                                                                        
  used                                                                          
  in                                                                            
  compu…                                                                        
  earni…                                                                        
  per                                                                           
  share:                                                                        
  Basic                406.4         414.2                410.1          413.9  
  Dilut…               410.1         428.4                414.6          426.8  
                                                                                
                                                                                
                                  CHEWY, INC.                                   
                                                                                
                                                                                
                CONDENSED CONSOLIDATED STATEMENTS OF CASH FLOWS                 
                                                                                
                                 (in millions)                                  
                                                                                
                                  (Unaudited)                                   
                                                                                
                                                     August 2,       August 3,  
                                     26 Weeks Ended       2026            2025  
 ────────────────────────────────────────────────────────────────────────────── 
  Cash flows from operating                                                     
  activities                                                                    
  Net income                         $                   175.3    $      124.4  
  Adjustments to reconcile net                                                  
  income to                                                                     
  net cash provided by operating                                                
  activities:                                                                   
  Depreciation and amortization                           76.7            62.1  
  Share-based compensation                               150.4           150.4  
  expense                                                                       
  Non-cash lease expense                                  19.6            17.4  
  Unrealized foreign currency                                                   
  (gains)                                                    —            -0.2  
  losses, net                                                                   
  Other adjustments                                        6.8             5.8  
  Net change in operating assets                                                
  and                                                                           
  liabilities:                                                                  
  Accounts receivable                                     -8.2           -52.1  
  Inventories                                            -44.9           -37.5  
  Prepaid expenses and other                                                    
  current                                                 -2.7           -32.2  
  assets                                                                        
  Other non-current assets                                -0.4               —  
  Trade accounts payable                                 -65.3            50.0  
  Accrued expenses and other                                                    
  current                                                -49.3           -49.8  
  liabilities                                                                   
  Operating lease liabilities                            -18.5           -16.9  
  Other long-term liabilities                              6.4            -1.1  
  Net cash provided by operating                         245.9           220.3  
  activities                                                                    
  Cash flows from investing                                                     
  activities                                                                    
  Capital expenditures                                   -85.6           -65.7  
  Purchases of marketable                                -21.4               —  
  securities                                                                    
  Proceeds from maturities of                                                   
  marketable                                              39.2               —  
  securities                                                                    
  Cash paid for acquisition of                                                  
  businesses,                                           -552.8               —  
  net of cash acquired                                                          
  Other investing activities                                 —            -5.2  
  Net cash (used in) investing                          -620.6           -70.9  
  activities                                                                    
  Cash flows from financing                                                     
  activities                                                                    
  Repurchases of common stock                           -400.0          -152.6  
  Proceeds from, net of income                                                  
  taxes paid                                               4.3             2.3  
  for, parent reorganization                                                    
  transaction                                                                   
  Repayment of borrowings and                                                   
  related                                                    —            -0.8  
  financing costs                                                               
  Proceeds from debt                                     811.7               —  
  Principal repayments of debt                          -220.0               —  
  Payments for tax withholdings                                                 
  related to                                                                    
  vesting of share-based                                 -68.7               —  
  compensation                                                                  
  awards                                                                        
  Other                                                   -1.4            -2.9  
  Net cash provided by (used in)                                                
  financing                                              125.9          -154.0  
  activities                                                                    
  Effect of exchange rate changes                                               
  on cash                                                 -0.3             0.6  
  and cash equivalents                                                          
  Net (decrease) in cash and cash                       -249.1            -4.0  
  equivalents                                                                   
  Cash and cash equivalents, as                                                 
  of                                                     860.1           595.8  
  beginning of period                                                           
  Cash and cash equivalents, as                                                 
  of end of                          $                   611.0    $      591.8  
  period                                                                        
                                                                                
                                                                                
  Non-GAAP Financial Measures                                                   
                                                                                
To supplement our GAAP results, we present certain non-GAAP financial measures
that management uses to evaluate operating performance, assess liquidity, and
inform capital allocation decisions. These measures include Adjusted EBITDA and
Adjusted EBITDA margin, Adjusted net income and Adjusted earnings per share, and
Free cash flow.
Adjusted EBITDA excludes depreciation and amortization, share-based compensation
and related taxes, income tax provision (benefit), interest income (expense),
transaction-related costs, net legal settlement proceeds, changes in the fair
value of equity warrants, severance and exit costs, and other items not
considered indicative of our core operations. Adjusted EBITDA margin represents
Adjusted EBITDA as a percentage of net sales.

Adjusted net income and Adjusted earnings per share exclude certain non-cash and
non-recurring items, including share-based compensation and related taxes,
releases of valuation allowances associated with deferred tax assets,
transaction-related costs, net legal settlement proceeds, changes in the fair
value of equity warrants, and severance and exit costs. Beginning in the first
quarter of 2026, Adjusted net income excludes transaction-related costs
prospectively.

Free cash flow represents net cash provided by operating activities less capital
expenditures.

We believe these measures provide additional insight into the underlying trends
in our business and facilitate comparisons across reporting periods.
Reconciliations to the most directly comparable GAAP measures are provided
below.

These non-GAAP measures have limitations and should not be considered in
isolation or as a substitute for GAAP results. For example, Adjusted EBITDA does
not reflect capital expenditures, working capital requirements, interest income
(expense), income taxes, or share-based compensation, which remains a recurring
component of our compensation structure. In addition, other companies may
calculate non-GAAP measures differently, which may limit their comparability.
Accordingly, these measures should be considered together with our GAAP
financial statements and related disclosures.
                                                                                
  Key Financial and Operating Data                                              
                                                                                
We measure our business using both financial and operating data and use the
following metrics and measures to assess the near-term and long-term performance
of our overall business, including identifying trends, formulating financial
projections, making strategic decisions, assessing operational efficiencies, and
monitoring our business.
                                                                                
     (…                                                                         
     m…                                                                         
     e…                                                                         
     n…                                                                         
     s…                                                                         
     p…                                                                         
     a…                                                                         
     c…                                                                         
     p…                                                                         
     s…                                                                         
     d…  13  A…          A…                  26  A…          A…                 
     a…  W…  2,          3,          %       W…  2,          3,           %     
     p…  E…  2…          2…         C…       E…  2…          2…         Ch…     
 ────────────────────────────────────────────────────────────────────────────── 
  …                                                                             
  …                                                                             
  …                                                                             
  …                                                                             
  …      $   3…       $  3…         7…  %    $   6…       $  6…         7.5  %  
  …                                                                             
  …      $   8…       $  6…         2…  %    $   1…       $  1…         40…  %  
  …                                                                             
  …          2…  %       2…  %                   2…  %       2…  %              
  …                                                                             
  …      $   2…       $  1…         2…  %    $   4…       $  3…         27…  %  
  …                                                                             
  …                                                                             
  …          6…  %       5…  %                   7…  %       6…  %              
  …                                                                             
  …                                                                             
  …      $   1…       $  1…         5…  %    $   3…       $  2…         13…  %  
  …                                                                             
  …                                                                             
  …      $   0…       $  0…         3…  %    $   0…       $  0…         43…  %  
  …                                                                             
  …                                                                             
  …                                                                             
  …      $   0…       $  0…         4…  %    $   0…       $  0…         44…  %  
  …                                                                             
  …                                                                             
  …                                                                             
  …                                                                             
  …      $   0…       $  0…         8…  %    $   0…       $  0…         14…  %  
  …                                                                             
  …                                                                             
  …                                                                             
  …                                                                             
  …      $   0…       $  0…         9…  %    $   0…       $  0…         16…  %  
  …                                                                             
  …                                                                             
  …                                                                             
  …                                                                             
  …      $   1…       $  1…         2…  %    $   2…       $  2…         11…  %  
  …                                                                             
  …                                                                             
  …                                                                             
  …                                                                             
  …      $   8…       $  1…         -…  %    $   1…       $  1…         3.7  %  
  …                                                                             
  …                                                                             
  …          2…          2…         3…  %        2…          2…         3.8  %  
  …                                                                             
  …                                                                             
  …                                                                             
  …      $   6…       $  5…         1…  %    $   6…       $  5…         1.9  %  
  …                                                                             
  …                                                                             
  …                                                                             
  …      $   2…       $  2…         9…  %    $   5…       $  5…         9.9  %  
  …                                                                             
  …                                                                             
  …                                                                             
  …                                                                             
  …                                                                             
  a          8…  %       8…  %                   8…  %       8…  %              
  …                                                                             
  …                                                                             
  …                                                                             
  …                                                                             
  …                                                                             
  …                                                                             
  …                                                                             
  …                                                                             
  …                                                                             
  …                                                                             
  …                                                                             
  …                                                                             
  …                                                                             
  …                                                                             
  …                                                                             
  …                                                                             
  …                                                                             
  …                                                                             
  …                                                                             
  …                                                                             
  …                                                                             
  …                                                                             
  …                                                                             
  …                                                                             
  …                                                                             
  …                                                                             
  …                                                                             
  …                                                                             
  …                                                                             
  …                                                                             
  …                                                                             
  …                                                                             
  …                                                                             
  …                                                                             
  …                                                                             
  …                                                                             
  …                                                                             
  …                                                                             
  …                                                                             
  …                                                                             
  …                                                                             
  …                                                                             
  …                                                                             
  …                                                                             
  …                                                                             
  …                                                                             
  …                                                                             
  …                                                                             
  …                                                                             
  …                                                                             
  …                                                                             
  …                                                                             
  …                                                                             
  …                                                                             
  …                                                                             
  …                                                                             
  …                                                                             
  …                                                                             
  …                                                                             
  …                                                                             
  …                                                                             
  …                                                                             
  …                                                                             
  …                                                                             
  …                                                                             
  …                                                                             
  …                                                                             
  …                                                                             
  …                                                                             
  …                                                                             
  …                                                                             
  …                                                                             
  …                                                                             
  …                                                                             
  …                                                                             
  …                                                                             
  …                                                                             
  …                                                                             
  …                                                                             
  …                                                                             
  …                                                                             
  …                                                                             
  …                                                                             
  …                                                                             
  …                                                                             
  …                                                                             
  …                                                                             
  …                                                                             
  …                                                                             
  …                                                                             
  …                                                                             
  …                                                                             
  …                                                                             
  …                                                                             
  …                                                                             
  …                                                                             
  …                                                                             
  …                                                                             
  …                                                                             
  …                                                                             
                                                                                
We define net margin as net income divided by net sales and adjusted EBITDA
margin as adjusted EBITDA divided by net sales.

Adjusted EBITDA and Adjusted EBITDA Margin

The following table presents a reconciliation of net income to adjusted EBITDA,
as well as the calculation of net margin and adjusted EBITDA margin, for each of
the periods indicated:
                                                                                
        Reco…                                                                   
        of                                                                      
        Net                                                                     
  (in   Inco…                                                                   
  mil…  to     13     Augu…          Augu…       26     Augu…          Aug…     
  exc…  Adju…  Weeks     2,             3,       Weeks     2,            3,     
  per…  EBIT…  Ended   2026           2025       Ended   2026          2025     
 ────────────────────────────────────────────────────────────────────────────── 
  Net          $       80.5       $   62.0       $      175.3       $  124…     
  inc…                                                                          
  Add                                                                           
  (de…                                                                          
  Dep…                                                                          
  and                  39.7           32.1               76.7          62.1     
  amo…                                                                          
  Sha…                                                                          
  com…                                                                          
  exp…                 85.9           79.1              159.3          157…     
  and                                                                           
  rel…                                                                          
  tax…                                                                          
  Int…                                                                          
  exp…                  4.7           -3.9                1.9          -7.1     
  (in…                                                                          
  net                                                                           
  Cha…                                                                          
  in                                                                            
  fair                                                                          
  val…                    —              —                  —           2.6     
  of                                                                            
  equ…                                                                          
  war…                                                                          
  Inc…                                                                          
  tax                  31.4           12.0               67.9          27.5     
  pro…                                                                          
  Exit                    —              —                1.9             —     
  cos…                                                                          
  Sev…                    —              —                  —           5.9     
  cos…                                                                          
  Net                                                                           
  leg…                -24.0              —              -24.0             —     
  set…                                                                          
  pro…                                                                          
  Tra…                                                                          
  rel…                  6.4            0.6               16.2           0.7     
  cos…                                                                          
  Oth…                  2.1            1.4                4.6           2.8     
  Adj…         $      226.7       $  183.3       $      479.8       $  376…     
  EBI…                                                                          
  Net          $      3,33…       $  3,10…       $      6,68…       $  6,2…     
  sal…                                                                          
  Net                   2.4  %         2.0  %             2.6  %        2.0  %  
  mar…                                                                          
  Adj…                                                                          
  EBI…                  6.8  %         5.9  %             7.2  %        6.0  %  
  mar…                                                                          
                                                                                
Adjusted Net Income and Adjusted Basic and Diluted Earnings per Share
The following table presents a reconciliation of net income to adjusted net
income, as well as the calculation of adjusted basic and diluted earnings per
share, for each of the periods indicated:
                                                                                
  (in                                                                           
  mil…                                                                          
  exc…                                                                          
  per                                                                           
  sha…                                                                          
  dat…                                                                          
  Rec…                                                                          
  of                                                                            
  Net     13                                   26                               
  Inc…    Weeks                                Weeks                            
  to      Ended                                Ended                            
  Adj…    Augu…             Augu…              Augu…             Augu…          
  Net     2,                3,                 2,                3,             
  Inc…    2026              2025               2026              2025           
 ────────────────────────────────────────────────────────────────────────────── 
  Net     $         80.5    $          62.0    $        175.3    $        124…  
  inc…                                                                          
  Add:                                                                          
  Sha…                                                                          
  com…                                                                          
  exp…              85.9               79.1             159.3             157…  
  and                                                                           
  rel…                                                                          
  tax…                                                                          
  Cha…                                                                          
  in                                                                            
  fair                                                                          
  val…                 —                  —                 —              2.6  
  of                                                                            
  equ…                                                                          
  war…                                                                          
  Exit                 —                  —               1.9                —  
  cos…                                                                          
  Sev…                 —                  —                 —              5.9  
  cos…                                                                          
  Net                                                                           
  leg…             -24.0                  —             -24.0                —  
  set…                                                                          
  pro…                                                                          
  Tra…                                                                          
  rel…               6.4           —                     16.2                —  
  cos…                                                                          
  Adj…                                                                          
  net     $        148.8    $         141.1    $        328.7    $        290…  
  inc…                                                                          
  Wei…                                                                          
  com…                                                                          
  sha…                                                                          
  used                                                                          
  in                                                                            
  com…                                                                          
  ear…                                                                          
  per                                                                           
  sha…                                                                          
  and                                                                           
  adj…                                                                          
  ear…                                                                          
  per                                                                           
  sha…                                                                          
  Bas…             406.4              414.2             410.1             413…  
  Eff…                                                                          
  of                                                                            
  dil…               3.7               14.2               4.5             12.9  
  sha…                                                                          
  awa…                                                                          
  Dil…             410.1              428.4             414.6             426…  
  Ear…                                                                          
  per                                                                           
  sha…                                                                          
  att…                                                                          
  to                                                                            
  com…                                                                          
  Cla…                                                                          
  A                                                                             
  and                                                                           
  Cla…                                                                          
  B                                                                             
  sto…                                                                          
  Bas…    $         0.20    $          0.15    $         0.43    $        0.30  
  Dil…    $         0.20    $          0.14    $         0.42    $        0.29  
  Adj…    $         0.37    $          0.34    $         0.80    $        0.70  
  bas…                                                                          
  Adj…    $         0.36    $          0.33    $         0.79    $        0.68  
  dil…                                                                          
                                                                                
Free Cash Flow

The following table presents a reconciliation of net cash provided by operating
activities to free cash flow for each of the periods indicated:
                                                                                
         Recon…                                                                 
         of Net                                                                 
         Cash                                                                   
         Provi…                                                                 
         by                                                                     
         Opera…                                                                 
         Activ…                                                                 
         to                                                                     
         Free    13                    August    26       August                
  (in    Cash    Weeks    August           3,    Weeks        2,        August  
  mill…  Flow    Ended   2, 2026         2025    Ended      2026       3, 2025  
 ────────────────────────────────────────────────────────────────────────────── 
  Net                                                                           
  cash                                                                          
  prov…          $         137.4    $   133.9    $         245.9    $    220.3  
  by                                                                            
  oper…                                                                         
  acti…                                                                         
  Dedu…                                                                         
  Capi…                    -47.9        -28.0              -85.6         -65.7  
  expe…                                                                         
  Free                                                                          
  Cash           $          89.5    $   105.9    $         160.3    $    154.6  
  Flow                                                                          
                                                                                
Free cash flow may vary period to period based on the timing and level of
capital expenditures, including investments in fulfillment capacity, pharmacy
facilities, veterinary clinics, technology infrastructure, and other operational
initiatives. Free cash flow may also be affected by changes in working capital,
including fluctuations in inventory levels, vendor payment terms, and other
components of the cash conversion cycle.
Investor Contact:

[email protected]

Media Contact:
Diane Pelkey

[email protected]

Sources

The 8-K item 2.02 filings (SEC EDGAR) and their EX-99 exhibits: the results release and, when filed, prepared remarks or the call transcript.

Also

Said vs did: the targets in these releases against what was then reported. Filings: every filing.

Work with it

Excel workbook · CSV. Google Sheet that stays up to date: paste =IMPORTDATA("https://tickdelta.com/company/CHWY/export.csv") into a cell.

Next:Presentations
Esc

Type a ticker such as AAPL, a name, an investor such as Buffett, or a topic such as tariffs. ↑ ↓ to move, Enter to open.