Covista Inc. CVSA
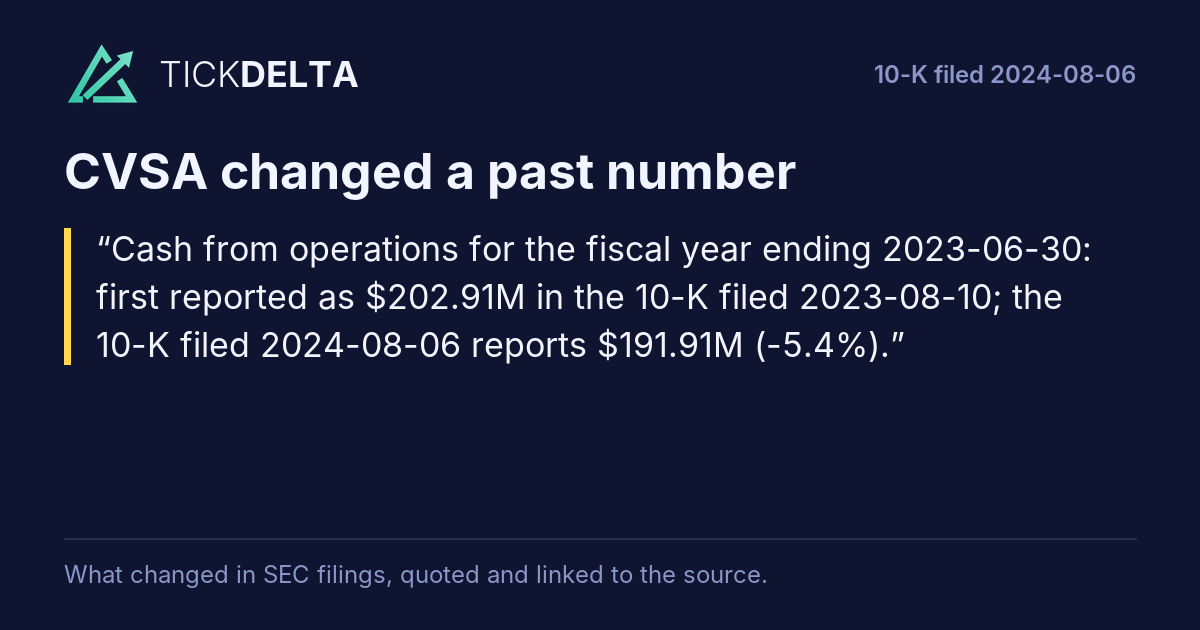
13 numbers reported differently in a later 10-K
XBRL, 6 10-KsA change is a restatement (the company says the earlier number was wrong) or a recast: after selling a business, adopting an accounting rule or moving amounts between lines, companies redo past years. The later 10-K's notes say which.
First reported, then reported again
Number by number · each number links to its 10-K
Each bar is the change from the number first reported to the number a later 10-K gives, on one scale; the 3 smaller ones are in the table.
| Number | Period | First reported | Later reported | Change |
|---|---|---|---|---|
| Cash from operations NetCashProvidedByUsedInOperatingActivities · link |
Fiscal year ending Jun 30, 2023 | $202.91M 10-K filed Aug 10, 2023 |
$191.91M 10-K filed Aug 6, 2024 |
-5.4% |
| Operating income OperatingIncomeLoss · link |
Fiscal year ending Jun 30, 2022 | $80.46M 10-K filed Aug 11, 2022 |
$76.75M 10-K filed Aug 10, 2023 |
-4.6% |
| Net income NetIncomeLoss · link |
Fiscal year ending Jun 30, 2022 | $317.70M 10-K filed Aug 11, 2022 |
$310.99M 10-K filed Aug 10, 2023 |
-2.1% |
| Cash from operations NetCashProvidedByUsedInOperatingActivities · link |
Fiscal year ending Jun 30, 2022 | $10.42M 10-K filed Aug 11, 2022 |
$10.60M 10-K filed Aug 10, 2023 |
+1.7% |
| Shareholders' equity StockholdersEquity · link |
At Jun 30, 2022 | $1.51B 10-K filed Aug 11, 2022 |
$1.49B 10-K filed Aug 10, 2023 |
-0.9% |
| Revenue Revenues · link |
Fiscal year ending Jun 30, 2021 | $1.11B 10-K filed Aug 19, 2021 |
$906.90M 10-K filed Aug 11, 2022 |
-18.5% |
| Revenue Revenues · link |
Fiscal year ending Jun 30, 2021 | $1.11B 10-K filed Aug 19, 2021 |
$899.25M 10-K filed Aug 10, 2023 |
-19.2% |
| Operating income OperatingIncomeLoss · link |
Fiscal year ending Jun 30, 2021 | $161.48M 10-K filed Aug 19, 2021 |
$118.05M 10-K filed Aug 11, 2022 |
-26.9% |
| Operating income OperatingIncomeLoss · link |
Fiscal year ending Jun 30, 2021 | $161.48M 10-K filed Aug 19, 2021 |
$110.40M 10-K filed Aug 10, 2023 |
-31.6% |
| Net income NetIncomeLoss · link |
Fiscal year ending Jun 30, 2021 | $76.91M 10-K filed Aug 19, 2021 |
$70.03M 10-K filed Aug 10, 2023 |
-8.9% |
| Total assets Assets · link |
At Jun 30, 2021 | $3.05B 10-K filed Aug 19, 2021 |
$3.08B 10-K filed Aug 11, 2022 |
+1.0% |
| Shareholders' equity StockholdersEquity · link |
At Jun 30, 2021 | $1.30B 10-K filed Aug 19, 2021 |
$1.29B 10-K filed Aug 10, 2023 |
-0.6% |
| Receivables AccountsReceivableNetCurrent · link |
At Jun 30, 2021 | $65.91M 10-K filed Aug 19, 2021 |
$40.95M 10-K filed Aug 11, 2022 |
-37.9% |
From SEC's XBRL company facts (6 10-K filings). Checked: revenue, operating income, net income, cash from operations, total assets, shareholders' equity, receivables and inventory. Per-share numbers are left out because stock splits change them.
Sources
SEC's XBRL company facts: each 10-K's number for a year, against the number a later 10-K gives for the same year and line.
Also
Accounting checks: the checks run on the latest 10-K.
Work with it
Excel workbook · CSV. Google Sheet that stays up to date: paste =IMPORTDATA("https://tickdelta.com/company/CVSA/export.csv") into a cell.