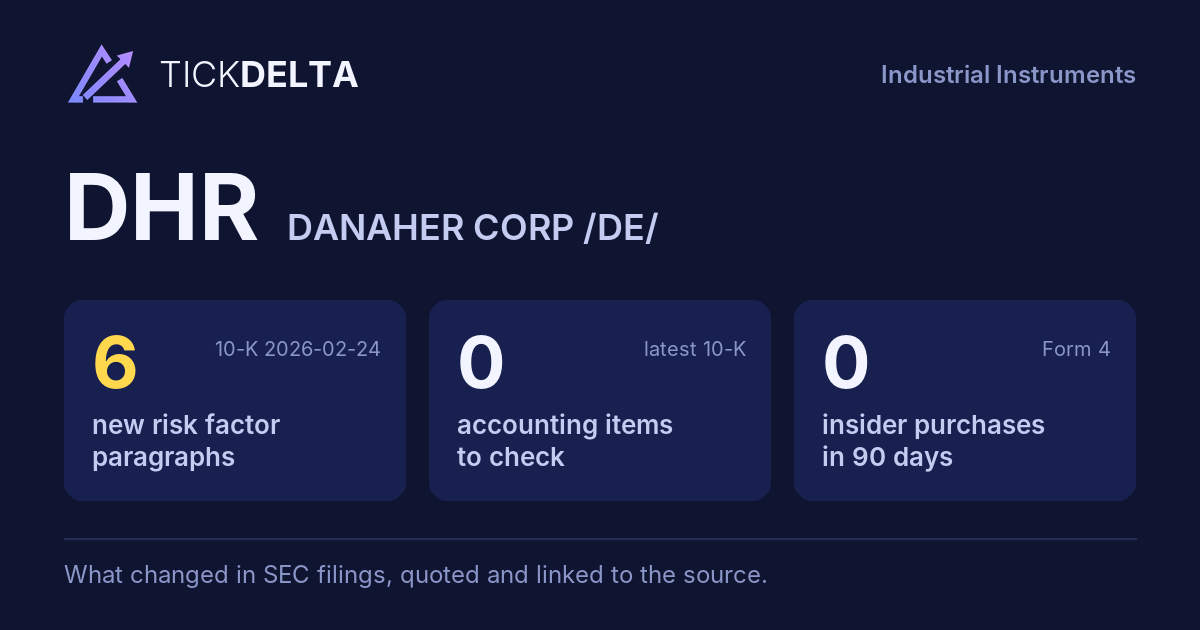
The biggest changes in the 10-K filed 2026-02-24, this fiscal year against the last, and the sentences in the MD&A (Item 7) where management explains them, quoted word for word. Tickdelta picks sentences that name the line, a direction and a cause. It does not write explanations of its own.
Operating margin
20.4% → 19.1% (-1.3 pts) Big change FY to 2025-12-31 vs 2024-12-31The MD&A has no sentence that names a cause for this change. That can be worth a question: ask about the filing.
Net income
-7.3% FY to 2025-12-31 vs 2024-12-31The MD&A has no sentence that names a cause for this change. That can be worth a question: ask about the filing.
Cash from operations
-4.1% FY to 2025-12-31 vs 2024-12-31“2025 operating cash flows from continuing operations reflected a decrease of $299 million in net earnings from continuing operations in 2025 as compared to 2024.”
Read it in the 10-K ↗
Gross margin
59.5% → 59.1% (-0.4 pts) FY to 2025-12-31 vs 2024-12-31“The year-over-year increase in cost of sales during 2025 as compared with 2024 was due primarily to the impact of higher year-over-year sales volumes and the impact of currency exchange rates.”
Read it in the 10-K ↗
“The year-over-year decrease in gross profit margin during 2025 as compared with 2024 was due primarily to the impact of currency exchange rates, tariff costs and the 2025 impairment charges discussed above, net of the net positive impact from the gross profit margin of recent acquisitions, the 2024 acquisition-related charge discussed above and the impact of product mix.”
Read it in the 10-K ↗
Revenue
+2.9% FY to 2025-12-31 vs 2024-12-31“Geographically, the Company’s sales in developed markets in 2025 increased 3% compared to 2024 and core sales in developed markets were up low-single digits driven primarily by mid-single digit core sales increases in Western Europe.”
Read it in the 10-K ↗
“For the same period, sales in high-growth markets increased year-over-year by 2% and core sales in high-growth markets were up low-single digits as a mid-single digit decline in core revenue in China was more than offset by increased core sales in other regions.”
Read it in the 10-K ↗
Changes are computed from the XBRL figures in the same 10-K. Hover a number to see the line item. Open the 10-K ↗
Work on DHR in a spreadsheet:
Excel workbook (a sheet per section, ten years by column, charts, links to the filings) ·
CSV.
For a Google Sheet that stays up to date, paste =IMPORTDATA("https://tickdelta.com/company/DHR/export.csv") into a cell.