DOVDover Corporation
- Employees
- 24,000
- Headquarters
- Downers Grove, IL
- CEO
- Richard J. Tobin
- Next results
- around Jan 28, 2027
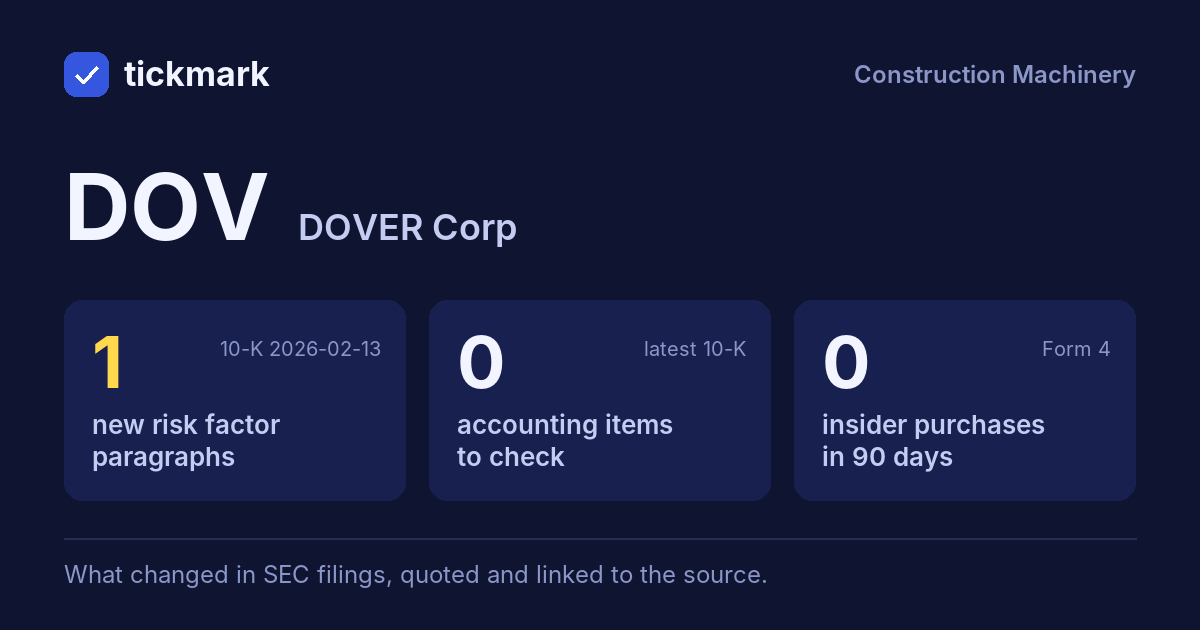
The biggest changes in the 10-K filed 2026-02-13, this fiscal year against the last, and the sentences in the MD&A (Item 7) where management explains them, quoted word for word. Tickdelta picks sentences that name the line, a direction and a cause. It does not write explanations of its own.
Net income
-59.4% Big change FY to 2025-12-31 vs 2024-12-31“For the year ended December 31, 2025, other income decreased compared to 2024 primarily due to decreased deferred compensation plan investment gain, decreased earnings from our equity method investments and foreign currency exchange loss.”
Read it in the 10-K ↗
Cash from operations
+23.0% Big change FY to 2025-12-31 vs 2024-12-31“The increases in cash flow from operating activities and free cash flow as percentages of earnings from continuing operations are due primarily to the gain on disposition of De-Sta-Co impacting the prior year.”
Read it in the 10-K ↗
Gross margin
38.2% → 39.8% (+1.6 pts) Big change FY to 2025-12-31 vs 2024-12-31“Gross profit for the year ended December 31, 2025, increased $259.5 million, or 8.8%, to $3.2 billion compared with 2024, primarily driven by favorable price versus cost dynamics, volume growth, product mix, and productivity actions.”
Read it in the 10-K ↗
“Gross profit margin increased 160 basis points to 39.8% as compared to the prior year driven by favorable price versus cost dynamics, productivity initiatives, favorable portfolio mix and benefits from restructuring actions.”
Read it in the 10-K ↗
Operating margin
15.6% → 17.0% (+1.4 pts) Big change FY to 2025-12-31 vs 2024-12-31“Selling, general and administrative expenses for the year ended December 31, 2025 increased $92.5 million, or 5.3% to $1.8 billion compared with 2024, primarily due to increased employee compensation and benefits and acquisition-related amortization.”
Read it in the 10-K ↗
Revenue
+4.5% FY to 2025-12-31 vs 2024-12-31“The 1.6% organic revenue growth was driven by increases of 6.7%, 4.6%, and 1.9% in our Pumps & Process Solutions, Clean Energy & Fueling, and Imaging & Identification segments, respectively, partially offset by the Engineered Products and Climate & Sustainability Technologies segments which declined 6.6% and 2.1%, respectively.”
Read it in the 10-K ↗
“From a geographic perspective, organic revenue for the U.S., our largest market, grew 3.3% as compared to the prior year, driven by broad-based growth primarily in our Clean Energy & Fueling and Pumps & Process Solutions segments.”
Read it in the 10-K ↗
Changes are computed from the XBRL figures in the same 10-K. Hover a number to see the line item. Open the 10-K ↗
Work on DOV in a spreadsheet:
Excel workbook (a sheet per section, ten years by column, charts, links to the filings) ·
CSV.
For a Google Sheet that stays up to date, paste =IMPORTDATA("https://tickdelta.com/company/DOV/export.csv") into a cell.