DPZDomino's
- Employees
- 10,200
- Headquarters
- Ann Arbor, MI
- CEO
- Joseph Hugh Jordan
- Next results
- around Feb 22, 2027
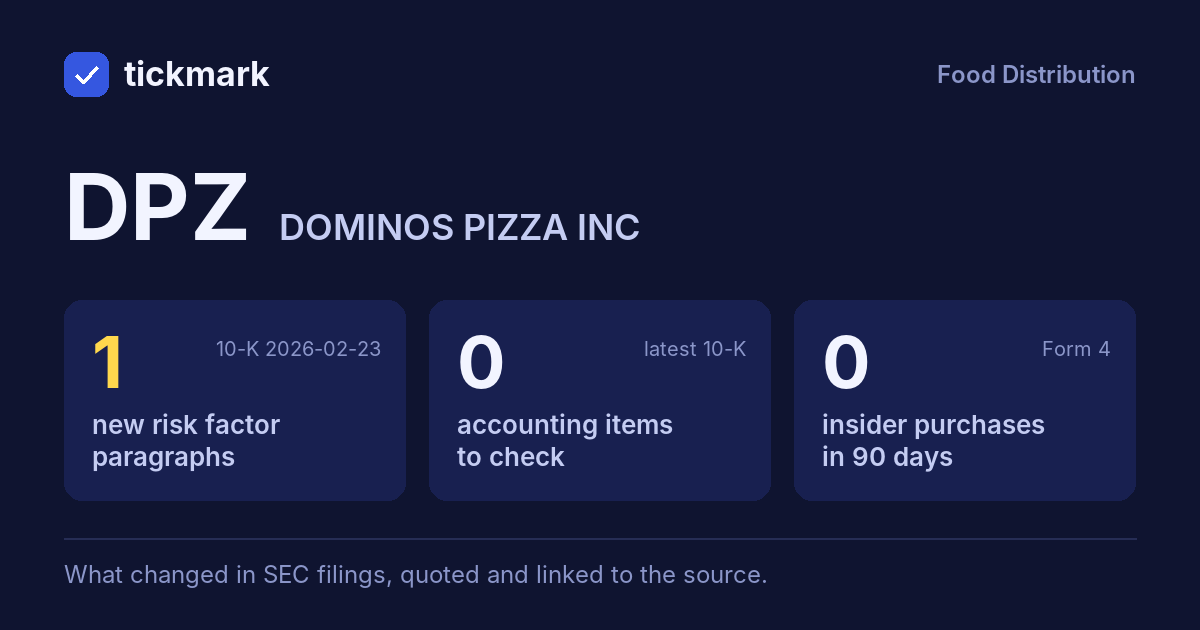
The biggest changes in the 10-K filed 2026-02-23, this fiscal year against the last, and the sentences in the MD&A (Item 7) where management explains them, quoted word for word. Tickdelta picks sentences that name the line, a direction and a cause. It does not write explanations of its own.
Cash from operations
+26.8% Big change FY to 2025-12-28 vs 2024-12-29“Cash provided by operating activities increased $167.2 million in 2025 primarily as a result of the positive impact of changes in operating assets and liabilities of $98.2 million, primarily related to the timing of vendor payments in 2025 as compared to 2024.”
Read it in the 10-K ↗
“The positive change in advertising fund assets and liabilities, restricted of $17.7 million in 2025 as compared to 2024 also contributed to the increase in cash provided by operating activities and was driven by receipts for advertising contributions outpacing payments for advertising activities.”
Read it in the 10-K ↗
Gross margin
39.3% → 40.0% (+0.7 pts) FY to 2025-12-28 vs 2024-12-29“Consolidated gross margin (which we define as revenues less cost of sales) increased $125.1 million, or 6.8%, in 2025 due primarily to higher U.S. franchise advertising, royalties and fees revenues, as well as gross margin dollar growth within supply chain discussed herein.”
Read it in the 10-K ↗
Operating margin
18.7% → 19.3% (+0.6 pts) FY to 2025-12-28 vs 2024-12-29“labor shortages or changes in operating expenses resulting from increases in prices of food (particularly cheese), fuel and other commodity costs, labor, utilities, insurance, employee benefits and other operating costs or negative economic conditions;”
Read it in the 10-K ↗
Revenue
+5.0% FY to 2025-12-28 vs 2024-12-29“Consolidated revenues increased $233.6 million, or 5.0%, in 2025 primarily due to higher supply chain revenues, higher U.S. franchise advertising revenues and higher U.S. franchise royalties and fees.”
Read it in the 10-K ↗
“Revenues from U.S. franchise royalties and fees increased $38.9 million, or 6.1%, in 2025 primarily due to higher same store sales and an increase in the average number of U.S. franchised stores open during the period resulting from net store growth.”
Read it in the 10-K ↗
Net income
+3.0% FY to 2025-12-28 vs 2024-12-29“Provision for income taxes increased $30.6 million, or 22.2%, in 2025 due to a higher effective tax rate, as well as an increase in income before provision for income taxes.”
Read it in the 10-K ↗
“The increase in the effective tax rate was driven by a 2.7 percentage point unfavorable change in the impact of excess tax benefits from equity-based compensation, which is recorded as a reduction to the provision for income taxes.”
Read it in the 10-K ↗
Changes are computed from the XBRL figures in the same 10-K. Hover a number to see the line item. Open the 10-K ↗
Work on DPZ in a spreadsheet:
Excel workbook (a sheet per section, ten years by column, charts, links to the filings) ·
CSV.
For a Google Sheet that stays up to date, paste =IMPORTDATA("https://tickdelta.com/company/DPZ/export.csv") into a cell.