Form 10-K
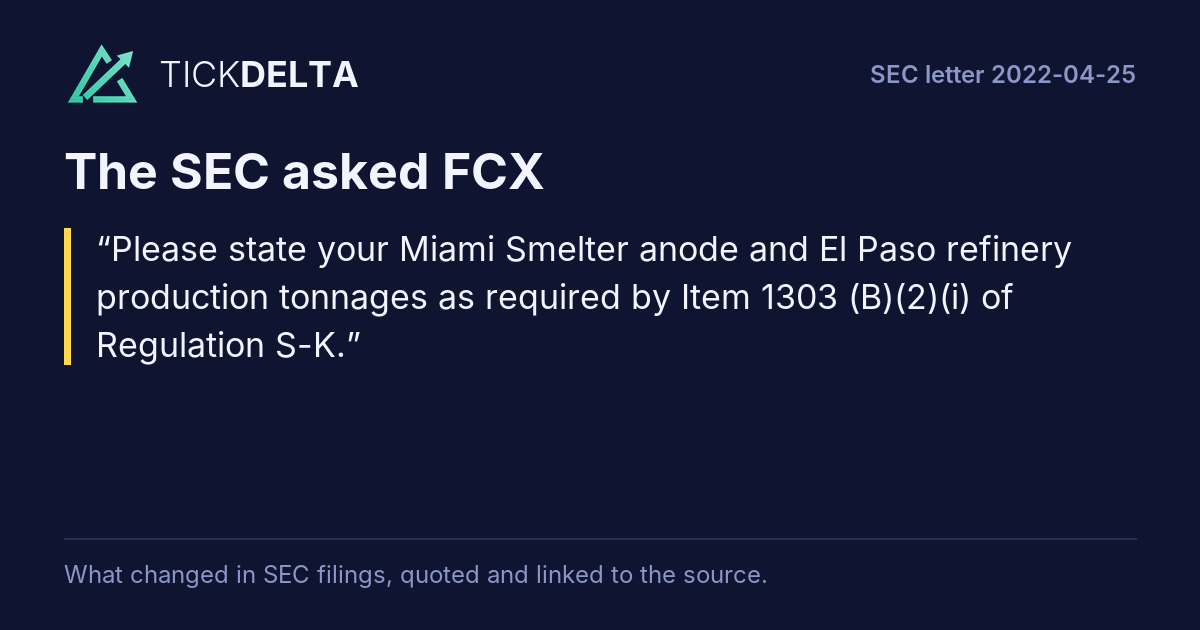
Please state your Miami Smelter anode and El Paso refinery production tonnages as required by Item 1303 (B)(2)(i) of Regulation S-K.
The Company will comply with this comment in future Form 10-K filings by providing Miami Smelter anode and El Paso refinery production tonnages in accordance with Item 1303(B)(2)(i) of Regulation S-K, beginning with its Form 10-K for the fiscal year ended December 31, 2022.
Specifically, the Company intends to revise the disclosure on page 24 of the 2021 Form 10-K under “Miami Smelter” to read as follows (new language underlined and in bold):
We own and operate a smelter at our Miami mining operation in Arizona.Read in the reply ↗Rest of the answer
The smelter has been operating for over 100 years and has been upgraded numerous times during that period to implement new technologies, improve production and comply with air quality requirements.
The Miami smelter processes copper concentrate primarily from our North America copper mines. Concentrate processed through the smelter totaled 674,000 metric tons in 2021, 764,000 metric tons in 2020 and 641,000 metric tons in 2019, and copper anode production from the smelter totaled 194,000 metric tons in 2021, 211,000 metric tons in 2020 and 173,000 metric tons in 2019. In addition, because sulfuric acid is a by-product of smelting concentrate, the Miami smelter is also the most significant source of sulfuric acid for our North America leaching operations.
* * *
The Company also intends to revise the paragraph under “Rod & Refining Operations” on page 24 of the 2021 Form 10-K to read as follows (replaced language with a strikethrough and new language underlined and in bold):
Our Rod & Refining operations consist of conversion facilities located in North America, including a refinery in El Paso, Texas and rod mills in El Paso, Texas, and Miami, Arizona. We refine our copper anode production from our Miami smelter at our El Paso refinery. The El Paso refinery has the potential to operate at an annual production capacity of about 900 million pounds approximately 410,000 metric tons of copper cathode, which is sufficient to refine all of the copper anode we produce at our Miami smelter. Copper cathode production from the El Paso refinery totaled 187,000 metric tons in 2021, 213,000 metric tons in 2020 and 169,000 metric tons in 2019. Our El Paso refinery also produces nickel carbonate, copper telluride and autoclaved slimes material containing gold, silver, platinum and palladium.
First report after the company's reply of 2022-05-19: 10-Q filed 2022-08-05 ↗, against the 10-Q filed 2021-11-05 ↗.
Tickdelta does not hold the text of both reports, so they are not compared here.
We note your reserves and resources are reported on a 100% basis in both your filing and exhibits. Please revise your filing and exhibits to disclose only that portion of the reserves and resources attributable to your ownership as required by Item 1303 (B)(3)(iii) of Regulation S-K.
The Company reports its reserve and resource information on a 100% basis and on a consolidated basis, in addition to its net equity interest, in its disclosures because it controls and operates all of its properties. The Company’s life-of-mine operating plans are designed to produce 100% of the reported reserves. The Company uses consolidated reserves as the basis for determining unit-of-production depreciation and for calculating any impairments of long-lived assets in its consolidated financial statements.Read in the reply ↗Rest of the answer
Accordingly, the Company believes these measures are material disclosures to the readers of its Form 10-K filings.
As discussed on its telephone call with the Staff on May 4, 2022, the Company will revise its disclosures in future Form 10-K filings to add information regarding its ownership interest in each mining property in order to comply with Item 1303(B)(3)(iii) of Regulation S-K, beginning with its Form 10-K for the fiscal year ended December 31, 2022.
Specifically, the Company intends to revise the mineral reserves and mineral resources summaries as follows:
For the 2021 Form 10-K:
Page 34 (Table for proven and probable reserves)
•Add a column identifying the Company’s net interest percentage for each property.
•Add columns to report tonnages adjusted for the Company’s net interest for each proven and probable reserve category.
Page 35 (Table for total proven and probable reserves)
•Add a column to report tonnages adjusted for the Company’s net interest in total proven and probable reserves.
Page 37 (Table summarizing annual changes for estimated recoverable mineral reserves)
•Add an additional table summarizing changes to the reserve estimates from the previous year to the current year representing the Company’s net interest.
Page 39 (Table summarizing mill and leach stockpiles)
•Add a column to report tonnages adjusted for the Company’s net interest in stockpiles.
Page 41 (Table for measured, indicated and inferred resources)
•Add columns to report tonnages adjusted for the Company’s net interest for each measured, indicated and inferred resource category.
Page 42 (Table for total measured, indicated and inferred resources)
•Add columns to report tonnages adjusted for the Company’s net interest for total measured and indicated resources and total measured, indicated and inferred resources.
Page 43 (Table summarizing annual changes for total contained mineral resources)
•Add an additional table summarizing changes to the resource estimates from the previous year to the current year representing the Company’s net interest.
Page 173 (Table for total proven and probable reserves)
For each Exhibit 96:
•Add a section at the bottom of each of the following mineral reserves and mineral resources summary tables that summarizes the Company’s and other’s net interests in each mining property:
Exhibit 96.1 (Cerro Verde mine)
•Tables 1.1 and 12.1
•Tables 1.2 and 11.5
Exhibit 96.2 (Grasberg minerals district)
•Tables 1.1 and 12.2
•Tables 1.2 and 11.4
Exhibit 96.3 (Morenci mine)
Examples of the intended revisions to the Company’s disclosures are provided in the attached Appendix A with changes highlighted with green shading.
First report after the company's reply of 2022-05-19: 10-Q filed 2022-08-05 ↗, against the 10-Q filed 2021-11-05 ↗.
Tickdelta does not hold the text of both reports, so they are not compared here.
We note you have included the Cerro Verde map on page 14 and the Grasberg map on page 59 of your Morenci mine technical report. Please correct these maps in your technical report.
Please refer to pages 14 and 59 of Exhibit 96.3 of the Company’s Form 10-K/A for the fiscal year ended December 31, 2021, filed February 18, 2022 (the Amended 2021 Form 10-K), in which the maps were corrected. Page 14 includes a property location map of the Morenci mine and page 59 includes a site infrastructure map of the Morenci district.
As the Company discussed on its telephone call with the Staff on May 4, 2022, due to a technical error in the Amended 2021 Form 10-K, Table 11.3 on page 43 of Exhibit 96.3 incorrectly reflected the economic and technical assumptions for resourceRead in the reply ↗Rest of the answer
evaluation for the Grasberg minerals district. Please refer to Table 11.3 on page 43 of Exhibit 96.3 filed with the 2021 Form 10-K for the correct version of that table, which reflects the economic and technical assumptions for resource evaluation for the Morenci mine. The Company will revise its disclosures in Exhibit 96 of future Form 10-K filings to include the correct Table 11.3, beginning with its Form 10-K for the fiscal year ended December 31, 2022.
First report after the company's reply of 2022-05-19: 10-Q filed 2022-08-05 ↗, against the 10-Q filed 2021-11-05 ↗.
Tickdelta does not hold the text of both reports, so they are not compared here.
Please explain how the cutoff grade was calculated for your crushed leach reserves. Exhibit 96.2, page E-49
The cutoff grade for the crushed leach reserves is the result of the “variable or operational cutoff grade” strategy, wherein multiple processing options, throughput constraints, open-pit phase development and ore availability are given consideration. In the life-of-mine plan, the crushed leach system is scheduled to operate until 2023, as shown on page 53 of Exhibit 96.1. The development of the open pit allows for material to be routed to the different processing facilities, accounting for variability by ore type, to provide the highest value.Read in the reply ↗Rest of the answer
The reported cutoff grade is the result of the mine plan development and reporting the lowest grade of ore planned to be sent to the process over the limited time frame.
First report after the company's reply of 2022-05-19: 10-Q filed 2022-08-05 ↗, against the 10-Q filed 2021-11-05 ↗.
Tickdelta does not hold the text of both reports, so they are not compared here.
We note your Grasberg technical report has the mine economics for the Morenci mine on page 49 and the resource summary for the Morenci mine on page 51. Please correct these tables in your technical report.
Please refer to pages 49 and 51 of Exhibit 96.2 of the Company’s Amended 2021 Form 10-K in which the tables were corrected. Read in the reply ↗
First report after the company's reply of 2022-05-19: 10-Q filed 2022-08-05 ↗, against the 10-Q filed 2021-11-05 ↗.
Tickdelta does not hold the text of both reports, so they are not compared here.
Please revise your resource and reserve summaries in your exhibits to clarify and distinguish between your breakeven and internal/marginal cutoff grades presented.
The Company will comply with this comment in future Form 10-K filings by revising its cutoff grade descriptions and resource and reserve summaries in each Exhibit 96 to clarify and distinguish between the Company’s cutoff grades, beginning with its Form 10-K for the fiscal year ended December 31, 2022.
Specifically, to better clarify its cutoff grade descriptions, in future filings the Company will revise the explanation of cutoff grades on page 37 of the 2021 Form 10-K as follows (replaced language with a strikethrough and new language underlined and in bold):
In defining our open-pitRead in the reply ↗Rest of the answer
mineral reserves, we apply a an “variable operational cutoff grade” strategy. The objective of this strategy is to maximize the net present value of our operations. In defining our open-pit mineral resources, internal cutoff grades are applied. The internal cutoff grade is defined for a metric ton of ore as that equivalent copper grade, once produced and sold, that generates sufficient revenue to cover estimated processing and administrative costs. We use a “break-even cutoff grades” to define the in-situ mineral reserves and resources for our underground ore bodies. The break-even cutoff grade is defined for a metric ton of ore as that equivalent copper grade, once produced and sold, that generates sufficient revenue to cover all operating and administrative costs associated with our production.
To align the resource and reserve summaries in each Exhibit 96 with future cutoff grade descriptions, the Company intends to revise its descriptions in the summaries from “Equivalent copper (EqCu)” to (new language underlined and in bold):
•“Operational cutoff grade reported as equivalent copper (EqCu)” in:
•Exhibit 96.1 (Cerro Verde mine) Tables 1.1 and 12.1.
•Exhibit 96.3 (Morenci mine) Tables 1.1 and 12.1
•“Internal cutoff grade reported as equivalent copper (EqCu)” in:
•Exhibit 96.1 (Cerro Verde mine) Tables 1.2 and 11.5.
•Exhibit 96.3 (Morenci mine) Tables 1.2 and 11.4.
•“Breakeven cutoff grade reported as equivalent copper (EqCu)” in:
•Exhibit 96.2 (Grasberg minerals district) Tables 1.1, 1.2, 11.4, and 12.2.
Additionally, the Company intends to revise footnote “d” to the “Estimated Mineral Resources” table on page 42 of the 2021 Form 10-K as follows (replaced language with a strikethrough and new language underlined and in bold):
All sites report a percent equivalent copper grade except for Climax and Henderson, which report a percent molybdenum grade. Cutoff grade is the minimum grade considered for processed material. Our underground mines report a breakeven cutoff grade, and our open-pit mines report an internal cutoff grade.
Please revise your commodity price forecast and explain with particularity how and when this price was determined with the assumptions underlying the price selection. See Item 601 (B)(96)(iii)(b)(11)(iii) of Regulation S-K.
As discussed on its telephone call with the Staff on May 4, 2022, the Company does not forecast or predict commodity prices; rather, the Company develops mine plans to be robust over a range of metal price scenarios.
Commodity price forecasts or projections reported in each Exhibit 96 (in Sections 16.2 and 19) reflect the economic assumptions used to determine mineral reserves and resources (in Sections 11 and 12), but are not a prediction of future commodity prices.Read in the reply ↗Rest of the answer
Evaluating the Company’s life-of-mine plans using these commodity prices demonstrates the economic viability of the mineral reserves at the selected prices, principally $2.50 per pound of copper.
To better clarify the use of the commodity prices, the Company will include statements similar to the following in each Exhibit 96 of future Form 10-K filings, beginning with its Form 10-K for the fiscal year ended December 31, 2022:
Addition to Section 16.2 – Commodity Prices Forecast and Contracts
•The commodity prices reported are used to demonstrate the economic viability of the mineral reserves and should not be construed as a prediction of future commodity prices.
Additions to Section 11.2.1 – Economic Assumptions
•The Company’s mineral reserves and resources are based on specific volumes of potentially economic, mineralized material in which the Company has the most confidence to produce an acceptable economic result, given a set of evaluation assumptions. As the Company continues to increase confidence through drilling, test work and the evaluation of engineering work and other modifying factors, it anticipates conversion of resources to reserves in the future, which may require higher metal prices.
•In developing the economic assumptions used to determine mineral reserves and resources during early 2021, the Company and its qualified persons made comparisons of its commodity price assumptions against various periods of historical average prices, spot prices, and long-term forward-looking price projections from 12 sources of market consensus services and financial institution reports covering periods ranging from 2022 to 2040, as reference points for reasonableness. The Company concluded that reserve price assumptions of $2.50 per pound of copper, $10 per pound of molybdenum, $1,200 per ounce of gold and $15 per ounce of silver were reasonable in comparison to the reference points and expected volumes of potentially economic material. The Company also concluded resource price assumptions of $3.00 per pound of copper, $12 per pound of molybdenum, $1,200 per ounce of gold and $20 per ounce of silver were reasonable and aligned with industry-accepted practice to use higher metal prices for the mineral resource estimates than the pricing used for determining mineral reserves.
•Selected prices for reserve and resource evaluation are reviewed at least annually with management. At the time of preparation of the 2021 Form 10-K, the Company and its qualified persons concluded that the metal price assumptions for reserve and resource determinations were still reasonable.
•For copper, the Company reviewed historical London Metal Exchange (LME) copper settlement prices over various historical periods. For the 10-year period ended December 31, 2020, the LME settlement price ranged from $1.96 per pound to $4.60 per pound and averaged $3.00 per pound. Forward-looking prices as of early 2021, ranged from $2.75 per pound to $6.80 per pound.
•For gold, the Company reviewed historical London PM gold prices over various historical periods. For the 10-year period ended December 31, 2020, the London PM gold price ranged from $1,049 per ounce to $2,067 per ounce, and averaged $1,401 per ounce. Forward-looking prices as of early 2021, ranged from $1,350 per ounce to $2,000 per ounce.
•For molybdenum, the Company reviewed historical weekly average molybdenum prices quoted by Metal Week over various historical periods. For the 10-year period ended December 31, 2020, the weekly average molybdenum price ranged from $4.46 per pound to $17.88 per pound and averaged $10.33 per pound. Forward-looking prices as of early 2021, ranged from $9.00 per pound to $12.00 per pound.
•For silver, the Company reviewed historical London PM silver prices over various historical periods. For the 10-year period ended December 31, 2020, the London PM silver price ranged from $12.01 per ounce to $48.70 per ounce and averaged $21.13 per ounce. Forward-looking prices as of early 2021, ranged from $16.50 per ounce to $19.30 per ounce.
Please revise your economic analysis to present the cash flow information on an annual basis with additional line items to clarify your presentation. Additional line items would include revenues, royalties, taxes, by-products, etc.Rest of the question
See Item 601 (B)(96)(iii)(b)(19)(ii) of In closing, we remind you that the company and its management are responsible for the accuracy and adequacy of their disclosures, notwithstanding any review, comments, action or absence of action by the staff.
As discussed on its telephone call with the Staff on May 4, 2022, the Company has disclosed the results of the economic analysis in accordance with Item 601(B)(96)(iii)(b)(19)(ii).
The Company’s disclosures in Section 19 for each Exhibit 96 are intended to confirm the economic viability of the reserves and provide investors long-term cash flow forecasts to support the overall economics of the operation.Read in the reply ↗Rest of the answer
The Company’s disclosure in Table 19.3 for each Exhibit 96 provides the forecasted average annual cash flows for grouped periods (initially, five-year periods for the first ten years of each production schedule) based on an annual production schedule for the life of each operation.
The Company believes that providing annual estimates based on averages is a better representation than a specific year by year estimate because of inherent variability in the timing and amount of capital expenditures and annual mine plan sequencing over the life of long-lived reserves. As life-of-mine plans are refined periodically, the timing and amount of cash flows in specific annual periods are uncertain and can vary significantly year-to-year without material changes over multi-year time periods.
The Company has concluded that the net present values of the disclosed average annual cash flows are not materially different from the net present value of the annual cash flow estimates.
The Company believes the presentation of annual average cash flows for grouped periods both meets the disclosure requirements and are a better representation of the annual cash flow forecasts for the operations over the life of the operation.
To better clarify the purpose of these forecasted annual cash flow projections, the Company will include statements similar to the following in Table 19.3 of each Exhibit 96 included in future Form 10-K filings, beginning with its Form 10-K for the fiscal year ended December 31, 2022 (new language underlined and in bold):
The purpose of the presented figures is to demonstrate the economic viability of the mineral reserves. Given the long-lived nature of the reserves, inherent variability in the timing of capital expenditures and annual mine planning processes, the annual cash flows may vary in subsequent disclosures.
With respect to the requested line item disclosure, the Company will ensure the disclosure is revised to add revenues, royalties, by-product credits and taxes in future Form 10-K filings in accordance with Items 601(B)(96)(iii)(b)(19)(i) and (ii) of Regulation S-K, beginning with its Form 10-K for the fiscal year ended December 31, 2022.
Examples of the intended revisions to the Company’s disclosures are provided in the attached Appendix B with changes highlighted with green shading.
Also in this review: request for more time, 2022-04-27, closing letter, 2022-05-31