Flowserve Corp FLS
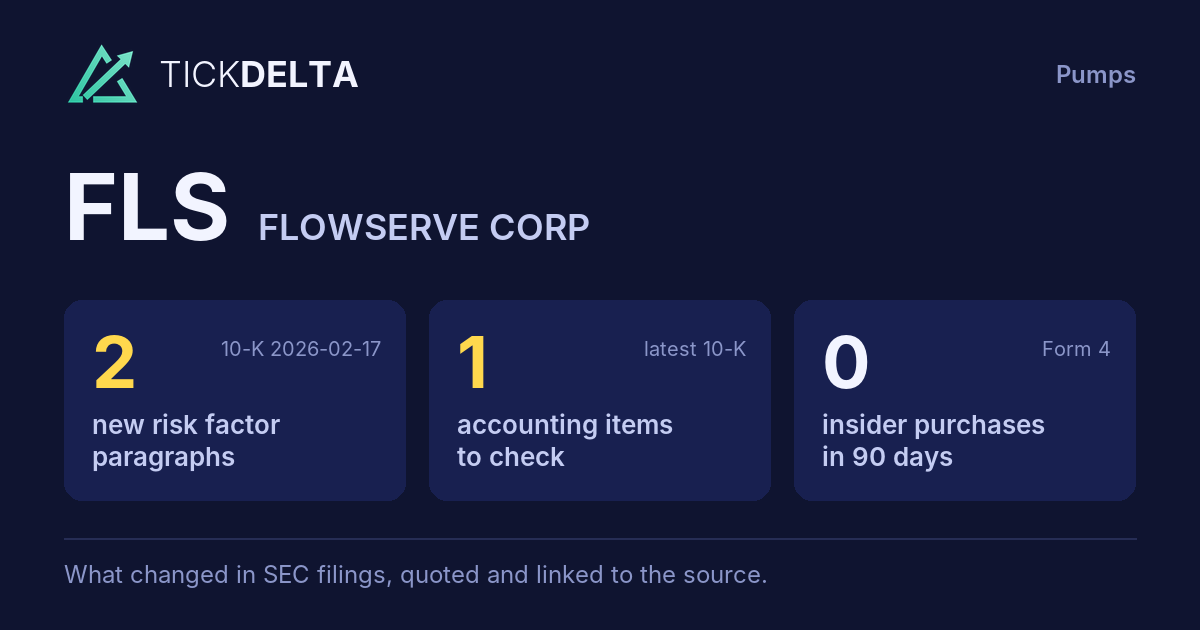
The biggest changes in the 10-K filed Feb 17, 2026, in management's words
10-K, Item 7This fiscal year against the last, and the sentences in the MD&A where management explains each change. Tickdelta picks sentences that name the line, a direction and a cause. It does not write explanations of its own.
Net income
Big change, FY to Dec 31, 2025 vs Dec 31, 2024
“Net earnings from affiliates in 2025 increased by $1.6 million, or 8.5%, as compared to the prior year, primarily as a result of increased earnings from our FPD joint venture in South Korea.”
Read it in the 10-K
“Our effective tax rate of 29.6% for the year ended December 31, 2025 increased from 22.0% in 2024 and differed from the federal statutory tax rate of 21% primarily due to the impacts pursuant to the enactment of the One Big Beautiful Bill Act (OBBBA) and its related impacts, the Asbestos Divestiture and, state income taxes, partially offset by the net impact of foreign operations.”
Read it in the 10-K
Gross margin
Big change, FY to Dec 31, 2025 vs Dec 31, 2024
“The decrease in gross profit margin was primarily due to increased charges of $23.0 million related to our realignment activities and an increase of $9.8 million of acquisition and integration”
Read it in the 10-K
Cash from operations
Big change, FY to Dec 31, 2025 vs Dec 31, 2024
The MD&A has no sentence that names a cause for this change.
Operating margin
Big change, FY to Dec 31, 2025 vs Dec 31, 2024
The MD&A has no sentence that names a cause for this change.
Revenue
Change, FY to Dec 31, 2025 vs Dec 31, 2024
“The increased sales were driven by aftermarket customer sales, with increased customer sales of $152 million into North America, $35 million into Africa and $34 million into the Middle East, partially offset by decreased customer sales of $46 million into Asia Pacific, $10 million into Latin America and $2 million in Europe.”
Read it in the 10-K
“SG&A as a percentage of sales for the twelve months ended increased 100 basis points driven by cost increases, including those associated with the termination of the planned merger with Chart.”
Read it in the 10-K
What management said, year by year
The cause given in each 10-K, 2 fiscal years, newest first · MD&A (Item 7)
Each bar is how the line changed that year (from the same 10-K's XBRL). Under it, the sentence in that year's MD&A that names the line, a direction and a cause, word for word. A year with no sentence says so.
Revenue
2 of 2 years explained-
FY 2025 +3.8%
“The increased sales were driven by aftermarket customer sales, with increased customer sales of $152 million into North America, $35 million into Africa and $34 million into the Middle East, partially offset by decreased customer sales of $46 million into Asia Pacific, $10 million into Latin America and $2 million in Europe.”
Read it in the FY 2025 10-K“SG&A as a percentage of sales for the twelve months ended increased 100 basis points driven by cost increases, including those associated with the termination of the planned merger with Chart.”
Read it in the FY 2025 10-K -
FY 2024 +5.5%
“The increased sales were driven by both aftermarket and original equipment customer sales, with increased customer sales of $86.1 million into the Middle East, $63.9 million into Europe, $52.4 million into Asia Pacific, $26.9 million into North America and $24.1 million into Latin America, partially offset by decreased customer sales of $2.5 million into Africa.”
Read it in the FY 2024 10-K“SG&A as a percentage of sales decreased 70 basis points primarily due to increased sales leverage.”
Read it in the FY 2024 10-K
Gross margin
1 of 2 years explained-
FY 2025 +2.0 pts
“The decrease in gross profit margin was primarily due to increased charges of $23.0 million related to our realignment activities and an increase of $9.8 million of acquisition and integration”
Read it in the FY 2025 10-K -
FY 2024 +1.9 pts
The FY 2024 MD&A has no sentence that names a cause for this change.
Operating margin
0 of 2 years explained-
FY 2025 -1.7 pts
The FY 2025 MD&A has no sentence that names a cause for this change.
-
FY 2024 +2.4 pts
The FY 2024 MD&A has no sentence that names a cause for this change.
Net income
2 of 2 years explained-
FY 2025 +22.5%
“Net earnings from affiliates in 2025 increased by $1.6 million, or 8.5%, as compared to the prior year, primarily as a result of increased earnings from our FPD joint venture in South Korea.”
Read it in the FY 2025 10-K“Our effective tax rate of 29.6% for the year ended December 31, 2025 increased from 22.0% in 2024 and differed from the federal statutory tax rate of 21% primarily due to the impacts pursuant to the enactment of the One Big Beautiful Bill Act (OBBBA) and its related impacts, the Asbestos Divestiture and, state income taxes, partially offset by the net impact of foreign operations.”
Read it in the FY 2025 10-K -
FY 2024 +51.4%
“Net earnings from affiliates in 2024 increased by $1.2 million, or 6.7%, as compared to the prior year, primarily as a result of increased earnings of our FPD joint venture in South Korea.”
Read it in the FY 2024 10-K“Our effective tax rate of 22.0% for the year ended December 31, 2024 increased from 8.3% in 2023 and differed from the federal statutory tax rate of 21% primarily due to the net impact of foreign divestiture and foreign operations.”
Read it in the FY 2024 10-K
Cash from operations
0 of 2 years explained-
FY 2025 +18.9%
The FY 2025 MD&A has no sentence that names a cause for this change.
-
FY 2024 +30.6%
The FY 2024 MD&A has no sentence that names a cause for this change.
Changes are computed from the XBRL figures in the same 10-K. Hover a number to see the line item. Open the 10-K
Sources
The Management's Discussion and Analysis (Item 7) of the latest 10-K, quoted word for word; the changes are computed from the same 10-K's XBRL.
Also
Financials: the numbers year by year.
Work with it
Excel workbook · CSV. Google Sheet that stays up to date: paste =IMPORTDATA("https://tickdelta.com/company/FLS/export.csv") into a cell.