Paragraph 54 · 32% changed
Every version of it
Screener
/
SEC EDGAR
/CIK 0000712534
/10-K filed Feb 25, 2026, compared with Feb 24, 2025
/Numbers from the XBRL of the 10-Ks
Nasdaq
Financials · Banks
First Merchants Corp FRME
The 10-K against last year's
129 changes: 12 added, 7 removed, 110 reworded
10-K Feb 25, 2026 vs Feb 24, 2025
Risk Factors
5.3%
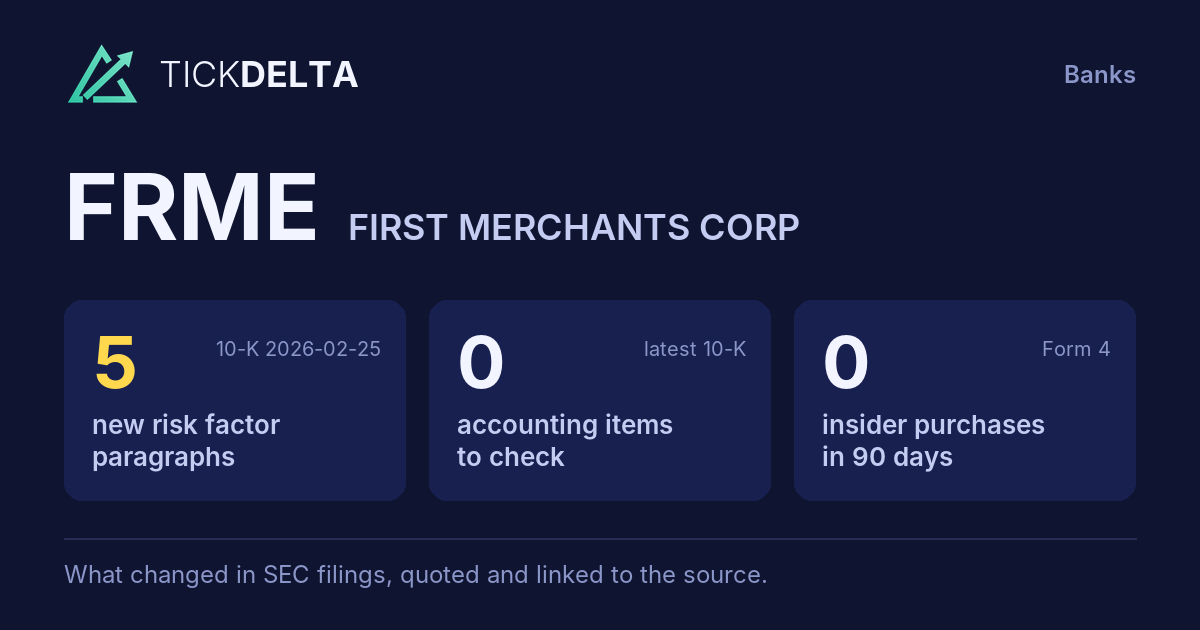
of the text changed · 7,574 words now · 5 new paragraphs, 0 gone
MD&A
24.4%
of the text changed · 12,344 words now · 7 new paragraphs, 7 gone
Accounting Policies
16.5%
of the text changed · 6,657 words now
10-K 0000712534-26-000022 (Feb 25, 2026) vs 10-K 0000712534-25-000058 (Feb 24, 2025) Not compared: Legal Proceedings.
Every paragraph, and how much of it changed
One bar per paragraph, in the order of the 10-K. Height and colour show the share of its words not in the closest paragraph a year earlier; the tallest bars are new paragraphs.
Risk Factors
83 paragraphs · 5 new · 14 reworded · 0 gone · 10-K Feb 25, 2026 against Feb 24, 2025
New paragraph
Reworded (5% of its words or more)
Same or nearly
Paragraph 56 · 22% changed
Every version of it
The global business community has increased continued its political and social awareness surrounding the state of the global environment and the issue of climate change. Further, the U.S. Congress, state legislatures and federal and state regulatory agencies continue to propose numerous initiatives related to climate change. Similar and even more expansive initiatives At the same time, some policymakers have adopted or are expected under the current administration, including potentially increasing supervisory expectations with respect to banks’ risk management practices, accounting for the effects of considering adopting, requirements that constrain climate change in stress testing scenarios and systemic risk assessments, revising expectations for credit portfolio concentrations based on climate-related factors and encouraging investment by banks in climate-related initiatives and lending to communities disproportionately impacted by the effects of climate change. initiatives. The lack of empirical data legislative or regulatory certainty surrounding the credit climate risk management and other financial risks posed by climate change practices make it impossible to predict how specifically climate change may impact our financial condition and results of operations. To the extent our customers experience unpredictable and more frequent weather disasters attributed to climate change, the value of real property securing the loans in our portfolios may be negatively impacted. Additionally, if insurance obtained by our borrowers is insufficient to cover any disaster-related losses sustained to the collateral, or if insurance coverage is otherwise unavailable to our borrowers, the collateral securing our loans may be negatively impacted by climate change, which could impact our financial condition and results of operations. Further, the effects of weather disasters attributed to climate change may negatively impact regional and local economic activity, which could lead to an adverse effect on our customers and impact the communities in which we operate. Overall, climate change, its effects and the resulting, unknown impact could have a material adverse effect on our financial condition and results of operations.
Paragraph 5 · 8% changed
Every version of it
In addition, an epidemic, a pandemic or another infectious disease outbreak could significantly impact households and businesses, or cause limitations on commercial activity, increased unemployment and general economic and financial instability. An economic slow-down in, or a reversal in an economic recovery of, the regions in which we conduct our business could result in declines in loan demand and collateral values. Furthermore, negative impacts on our customers caused by such a health crisis could result in increased risk of delinquencies, defaults, foreclosures and losses on our loans. Moreover, governmental and regulatory actions taken in response to an epidemic, a pandemic or another infectious disease outbreak may include decreased interest rates, which could adversely impact the Corporation’s interest margins and may lead to decreases in the Corporation’s net interest income.
Paragraph 53 · 7% changed
Every version of it
Paragraph 62 · 7% changed
Every version of it
The operations of financial institutions, such as the Corporation, are dependent to a large degree on net interest income, which is the difference between interest income from loans and investments and interest expense on deposits and borrowings. An institution’s net interest income is significantly affected by market rates of interest, which in turn are affected by prevailing economic conditions, by the fiscal and monetary policies of the federal government and by the policies of various regulatory agencies. In addition to affecting profitability, changes in interest rates can impact the valuation of assets and liabilities. For example, changes in reference rates linked to financial instruments, such as the Secured Overnight Financing Rate (“SOFR”), may adversely affect the value of financial instruments the Corporation holds or issues and related net interest income. Rate changes can also affect the ability of borrowers to meet obligations under variable or adjustable rate loans which in turn affect loss rates on those assets. Also, the demand for interest rate based products and services, including loans and deposit accounts, may decline resulting in the flow of funds away from financial institutions into direct investments. Direct investments, such as U.S. Government and corporate securities and other investment vehicles, including mutual funds, generally pay higher rates of return than financial institutions, because of the absence of federal insurance premiums and reserve requirements.
Paragraph 54 · 32% changed
Every version of it
10-K Feb 24, 2025Companies are facing increasing scrutiny from customers, regulators, investors, and other stakeholders related to their environmental, social and governance (“ESG”) practices and disclosure. Investor advocacy groups, investment funds and influential investors are also increasingly focused on these practices, especially as they relate to the environment, health and safety, diversity, labor conditions and human rights. Increased ESG-related compliance costs for the Corporation as well as among our suppliers, vendors and various other parties within our supply chain could result in increases to our overall operational costs. Failure to adapt to or comply with regulatory requirements or investor or stakeholder expectations and standards could negatively impact our reputation, ability to do business with certain partners, access to capital, and our stock price. New government regulations could also result in new or more stringent forms of ESG oversight and expanding mandatory and voluntary reporting, diligence, and disclosure.
10-K Feb 25, 2026
The expectations of customers, regulators, investors, and other stakeholders related to the Corporation’s environmental, social and governance (“ESG”) practices and disclosure continue to evolve. Failure to adapt to or comply with regulatory requirements or investor or stakeholder expectations and standards could negatively impact our reputation, ability to do business with certain partners, access to capital, and our stock price. New government regulations could also result in new or more stringent forms of ESG oversight and expanding mandatory and voluntary reporting, diligence, and disclosure.
Paragraph 56 · 22% changed
Every version of it
10-K Feb 24, 2025
The global business community has increased its political and social awareness surrounding the state of the global environment and the issue of climate change. Further, the U.S. Congress, state legislatures and federal and state regulatory agencies continue to propose numerous initiatives related to climate change. Similar and even more expansive initiatives are expected under the current administration, including potentially increasing supervisory expectations with respect to banks’ risk management practices, accounting for the effects of climate change in stress testing scenarios and systemic risk assessments, revising expectations for credit portfolio concentrations based on climate-related factors and encouraging investment by banks in climate-related initiatives and lending to communities disproportionately impacted by the effects of climate change. The lack of empirical data surrounding the credit and other financial risks posed by climate change make it impossible to predict how specifically climate change may impact our financial condition and results of operations. To the extent our customers experience unpredictable and more frequent weather disasters attributed to climate change, the value of real property securing the loans in our portfolios may be negatively impacted. Additionally, if insurance obtained by our borrowers is insufficient to cover any disaster-related losses sustained to the collateral, or if insurance coverage is otherwise unavailable to our borrowers, the collateral securing our loans may be negatively impacted by climate change, which could impact our financial condition and results of operations. Further, the effects of weather disasters attributed to climate change may negatively impact regional and local economic activity, which could lead to an adverse effect on our customers and impact the communities in which we operate. Overall, climate change, its effects and the resulting, unknown impact could have a material adverse effect on our financial condition and results of operations.
10-K Feb 25, 2026
The global business community has continued its political and social awareness surrounding the state of the global environment and the issue of climate change. Further, state legislatures and federal and state regulatory agencies continue to propose numerous initiatives related to climate change. At the same time, some policymakers have adopted or are considering adopting, requirements that constrain climate change initiatives. The lack of legislative or regulatory certainty surrounding climate risk management and practices make it impossible to predict how specifically climate change may impact our financial condition and results of operations. To the extent our customers experience unpredictable and more frequent weather disasters attributed to climate change, the value of real property securing the loans in our portfolios may be negatively impacted. Additionally, if insurance obtained by our borrowers is insufficient to cover any disaster-related losses sustained to the collateral, or if insurance coverage is otherwise unavailable to our borrowers, the collateral securing our loans may be negatively impacted by climate change, which could impact our financial condition and results of operations. Further, the effects of weather disasters attributed to climate change may negatively impact regional and local economic activity, which could lead to an adverse effect on our customers and impact the communities in which we operate. Overall, climate change, its effects and the resulting, unknown impact could have a material adverse effect on our financial condition and results of operations.
Paragraph 5 · 8% changed
Every version of it
10-K Feb 24, 2025
In addition, an epidemic, a pandemic or another infectious disease outbreak could significantly impact households and businesses, or cause limitations on commercial activity, increased unemployment and general economic and financial instability. An economic slow-down in, or a reversal in an economic recovery of, the regions in which we conduct our business could result in declines in loan demand and collateral values. Furthermore, negative impacts on our customers caused by such a health crisis could result in increased risk of delinquencies, defaults, foreclosures and losses on our loans. Moreover, governmental and regulatory actions taken in response to an epidemic, a pandemic or another infectious disease outbreak may include decreased interest rates, which could adversely impact the Corporation’s interest margins and may lead to decreases in the Corporation’s net interest income.
10-K Feb 25, 2026
In addition, an epidemic, a pandemic or another infectious disease outbreak could significantly impact households and businesses, or cause limitations on commercial activity, increased unemployment and general economic and financial instability. An economic slow-down in, or a reversal in an economic recovery of, the regions in which we conduct our business could result in declines in loan demand and collateral values. Furthermore, negative impacts on our customers caused by such a health crisis could result in increased risk of delinquencies, defaults, foreclosures and losses on our loans. Moreover, governmental and regulatory actions taken in response to an epidemic, a pandemic or another
Paragraph 53 · 7% changed
Every version of it
10-K Feb 24, 2025•Increasing scrutiny and evolving expectations from customers, regulators, investors, and other stakeholders with respect to the Corporation’s environmental, social and governance practices may impose additional costs on the Corporation or expose it to new or additional risks.
10-K Feb 25, 2026
•Evolving expectations from customers, regulators, investors, and other stakeholders with respect to the Corporation’s environmental, social and governance practices may impose additional costs on the Corporation or expose it to new or additional risks.
Paragraph 62 · 7% changed
Every version of it
10-K Feb 24, 2025
The operations of financial institutions, such as the Corporation, are dependent to a large degree on net interest income, which is the difference between interest income from loans and investments and interest expense on deposits and borrowings. An institution’s net interest income is significantly affected by market rates of interest, which in turn are affected by prevailing economic conditions, by the fiscal and monetary policies of the federal government and by the policies of various regulatory agencies. In addition to affecting profitability, changes in interest rates can impact the valuation of assets and liabilities. For example, changes in reference rates linked to financial instruments, such as the Secured Overnight Financing Rate (“SOFR”), may adversely affect the value of financial instruments the Corporation holds or issues and related net interest income. Rate changes can also affect the ability of borrowers to meet obligations under variable or adjustable rate loans which in turn affect loss rates on those assets. Also, the demand for interest rate based products and services, including loans and deposit accounts, may decline resulting in the flow of funds away from financial institutions into direct investments. Direct investments, such as U.S. Government and corporate securities and other investment vehicles, including mutual funds, generally pay higher rates of return than financial institutions, because of the absence of federal insurance premiums and reserve requirements.
10-K Feb 25, 2026
The operations of financial institutions, such as the Corporation, are dependent to a large degree on net interest income, which is the difference between interest income from loans and investments and interest expense on deposits and borrowings. An institution’s net interest income is significantly affected by market rates of interest, which in turn are affected by prevailing economic conditions, by the fiscal and monetary policies of the federal government and by the policies of various regulatory agencies. In addition to affecting profitability, changes in interest rates can impact the valuation of assets and liabilities. Rate changes can also affect the ability of borrowers to meet obligations under variable or adjustable rate loans which in turn affect loss rates on those assets. Also, the demand for interest rate based products and services, including loans and deposit accounts, may decline resulting in the flow of funds away from financial institutions into direct investments. Direct investments, such as U.S. Government and corporate securities and other investment vehicles, including mutual funds, generally pay higher rates of return than financial institutions, because of the absence of federal insurance premiums and reserve requirements.
MD&A
153 paragraphs · 7 new · 82 reworded · 7 gone · 10-K Feb 25, 2026 against Feb 24, 2025
New paragraph
Reworded (5% of its words or more)
Same or nearly
Paragraph 67 · 49% changed
Paragraph 66 · 49% changed
Paragraph 25 · 47% changed
Deposits increased $438.7 million $773.2 million, or 5.3 percent, from December 31, 2022. 2024. The majority of the organic deposit growth was due to increases in non-maturity deposits of $749.4 million. Lower interest rates have resulted in customers migrating funds from maturity time deposit products into non-maturity deposit products. Total deposits less time deposits greater than $100,000, or core deposits, represented 90.5 94.0 percent of the deposit portfolio at December 31, 2023. 2025. Noninterest bearing deposits represented 16.9 14.0 percent of the deposit portfolio, which is a decline from portfolio at December 31, 2022 of 22.1 percent. The decline is the result of a mix shift which occurred across the industry as clients moved into higher yielding deposit products. The Corporation experienced increases from 2025, compared to 16.0 percent at December 31, 2022 in certificates and other time deposits of $100,000 or more of $666.4 million, other certificates and time deposits of $381.2 million and brokered certificates of 2024. The loan to deposit of $14.7 million. Demand and savings accounts decreased from ratio increased to 90.3 percent at December 31, 2022 by $482.9 million and $140.7 million, respectively. 2025, from 88.6 percent at December 31, 2024.
Paragraph 65 · 44% changed
FTE net interest income decreased $24.9 increased $16.3 million, or 4.4 3.0 percent, during for the year ended December 31, 2024 compared to the year ended December 31, 2023. FTE interest income increased $58.7 million, or 7.5 percent, 2025 compared to the same period of 2024. The net interest margin improved to 3.25 percent from 3.19 percent, driven by a 35 basis point reduction in 2023 but was the cost of interest-bearing liabilities to 2.82 percent from 3.17 percent. This benefit more than offset a 19 basis point decline in asset yields to 5.50 percent, which was partially mitigated by a $78.4 million, or 22.5 percent increase in total $3.3 million interest expense. The increase in FTE interest income was primarily due to a shift recovery recognized in the earning asset mix from securities to loans as well as a 29 fourth quarter of 2025, which favorably impacted net interest margin by approximately 2 basis point increase in the yield earned on earning assets. Most notably, the yield earned on loans increased 29 basis points in 2024 compared to 2023. points.
Paragraph 81 · 43% changed
The Corporation’s tax asset, deferred and receivable decreased from $99.9 million at December 31, 2023 to $92.4 million at December 31, 2024. The $7.5 2024 to $78.7 million at December 31, 2025. This decrease was included a combination of reduction in the Corporation’s net deferred tax asset increasing from $84.7 million at December 31, 2023 to $85.9 million at December 31, 2024, and the income tax receivable decreasing from $15.2 2024 to $67.2 million at December 31, 2023 2025. The $18.7 million decrease in the net deferred tax asset was primarily attributable to $6.5 million at December 31, 2024. changes in temporary differences during the year, including the impact of unrealized gains and losses on available for sale securities, as well as other balance sheet driven tax adjustments.
Paragraph 95 · 43% changed
On November April 1, 2013, 2022, the Corporation completed the private issuance and sale to four institutional investors of an aggregate of $70.0 assumed $30.0 million of debt comprised subordinated notes in conjunction with its acquisition of (a) 5.00 percent Fixed-to-Floating Rate Senior Notes due 2028 Level One. On February 14, 2025, the Corporation, through its trustee, distributed notice of redemption of all $30.0 million in the aggregate principal amount of $5 million and (b) 6.75 its 4.75 percent Fixed-to-Floating Rate Subordinated Notes due October 30, 2028 in the aggregate principal amount of $65.0 million. December 18, 2029. The Corporation exercised its right to redeem $65 $30.0 million of the subordinated debt on the scheduled interest payment date during the first half of 2024. March 18, 2025.
Paragraph 64 · 41% changed
Average borrowings decreased $106.5 increased $133.7 million, or 9.6 13.3 percent, for the year ended December 31, 2024 2025 compared to the same period of 2023. 2024. This decrease increase was primarily driven by decreases increases of $53.8 million, $35.3 $140.7 million and $18.2 $38.9 million in the average balance of FHLB advances and federal funds purchased, respectively. Partially offsetting these increases was a $35.5 million decrease in the average balance of subordinated debt, repurchase agreements and fed funds purchased, respectively. The Corporation redeemed $65.0 reflecting the Corporation’s redemption of $30.0 million of subordinated debt in the first half quarter of 2024 which contributed to 2025 and the decrease redemption of $5.0 million of Senior Debt in the average balance third quarter of subordinated debt. 2025. The decreases increase in repurchase agreements borrowings supported loan growth and fed funds purchased were due primarily to helped manage the Corporation utilizing liquidity to pay down borrowings in 2024. funding mix while prudently optimizing the Corporation’s overall cost of funds.
Paragraph 23 · 40% changed
The Corporation’s tax asset, deferred and receivable decreased from $99.9 million at December 31, 2023 to $92.4 million at December 31, 2024. The $7.5 2024 to $78.7 million decrease was a combination of at December 31, 2025, which included the Corporation’s net deferred tax asset increasing decreasing from $84.7 million at December 31, 2023 to $85.9 million at December 31, 2024, and the income tax receivable decreasing from $15.2 2024 to $67.2 million at December 31, 2023 2025. The $18.7 million decrease in the Corporation’s net deferred tax asset was primarily attributable to $6.5 million at December 31, 2024. changes in temporary differences, including the impact of unrealized gains and losses on available‑for‑sale securities, as well as other balance sheet‑driven items during the year.
Paragraph 67 · 49% changed
10-K Feb 24, 2025FTE net interest income decreased $24.9 million, or 4.4 percent, during the year ended December 31, 2024 compared to the year ended December 31, 2023. FTE interest income increased $58.7 million, or 7.5 percent, compared to the same period in 2023 but was more than offset by a $78.4 million, or 22.5 percent increase in total interest expense. The increase in FTE interest income was primarily due to a shift in the earning asset mix from securities to loans as well as a 29 basis point increase in the yield earned on earning assets. Most notably, the yield earned on loans increased 29 basis points in 2024 compared to 2023.
10-K Feb 25, 2026
Interest expense on deposits decreased $38.1 million, reflecting lower rates across all deposit categories. The total cost of interest-bearing liabilities decreased 35 basis points, to 2.82 percent for the year ended December 31, 2025, down from 3.17 percent for the same period in 2024. The reduction in funding costs more than offset the decline in asset yields and resulted in a 16 basis point improvement in the FTE net interest spread, which increased to 2.68 percent from 2.52 percent.
Paragraph 66 · 49% changed
10-K Feb 24, 2025Net interest margin, on an FTE basis, decreased 16 basis points to 3.19 percent for the year ended December 31, 2024 compared to 3.35 percent for the same period in 2023.
10-K Feb 25, 2026
Interest income on an FTE basis decreased $21.8 million for the year ended December 31, 2025, compared to the same period of 2024. The decrease was primarily due to lower yields on variable rate loans following the Federal Open Market Committee’s 100 basis point rate cut in the second half of 2024 and an additional 75 basis point reduction in the second half of 2025. The yield on commercial loans and tax-exempt loans decreased 55 basis points and 54 basis points, respectively, in 2025 compared to 2024.
Paragraph 25 · 47% changed
10-K Feb 24, 2025
Deposits increased $438.7 million from December 31, 2022. Total deposits less time deposits greater than $100,000, or core deposits, represented 90.5 percent of the deposit portfolio at December 31, 2023. Noninterest bearing deposits represented 16.9 percent of the deposit portfolio, which is a decline from December 31, 2022 of 22.1 percent. The decline is the result of a mix shift which occurred across the industry as clients moved into higher yielding deposit products. The Corporation experienced increases from December 31, 2022 in certificates and other time deposits of $100,000 or more of $666.4 million, other certificates and time deposits of $381.2 million and brokered certificates of deposit of $14.7 million. Demand and savings accounts decreased from December 31, 2022 by $482.9 million and $140.7 million, respectively.
10-K Feb 25, 2026
Deposits increased $773.2 million, or 5.3 percent, from December 31, 2024. The majority of the organic deposit growth was due to increases in non-maturity deposits of $749.4 million. Lower interest rates have resulted in customers migrating funds from maturity time deposit products into non-maturity deposit products. Total deposits less time deposits greater than $100,000, or core deposits, represented 94.0 percent of the deposit portfolio at December 31, 2025. Noninterest bearing deposits represented 14.0 percent of the deposit portfolio at December 31, 2025, compared to 16.0 percent at December 31, 2024. The loan to deposit ratio increased to 90.3 percent at December 31, 2025, from 88.6 percent at December 31, 2024.
Paragraph 65 · 44% changed
10-K Feb 24, 2025
FTE net interest income decreased $24.9 million, or 4.4 percent, during the year ended December 31, 2024 compared to the year ended December 31, 2023. FTE interest income increased $58.7 million, or 7.5 percent, compared to the same period in 2023 but was more than offset by a $78.4 million, or 22.5 percent increase in total interest expense. The increase in FTE interest income was primarily due to a shift in the earning asset mix from securities to loans as well as a 29 basis point increase in the yield earned on earning assets. Most notably, the yield earned on loans increased 29 basis points in 2024 compared to 2023.
10-K Feb 25, 2026
FTE net interest income increased $16.3 million, or 3.0 percent, for the year ended December 31, 2025 compared to the same period of 2024. The net interest margin improved to 3.25 percent from 3.19 percent, driven by a 35 basis point reduction in the cost of interest-bearing liabilities to 2.82 percent from 3.17 percent. This benefit more than offset a 19 basis point decline in asset yields to 5.50 percent, which was partially mitigated by a $3.3 million interest recovery recognized in the fourth quarter of 2025, which favorably impacted net interest margin by approximately 2 basis points.
Paragraph 81 · 43% changed
10-K Feb 24, 2025
The Corporation’s tax asset, deferred and receivable decreased from $99.9 million at December 31, 2023 to $92.4 million at December 31, 2024. The $7.5 million decrease was a combination of the Corporation’s net deferred tax asset increasing from $84.7 million at December 31, 2023 to $85.9 million at December 31, 2024, and the income tax receivable decreasing from $15.2 million at December 31, 2023 to $6.5 million at December 31, 2024.
10-K Feb 25, 2026
The Corporation’s tax asset, deferred and receivable decreased from $92.4 million at December 31, 2024 to $78.7 million at December 31, 2025. This decrease included a reduction in the Corporation’s net deferred tax asset from $85.9 million at December 31, 2024 to $67.2 million at December 31, 2025. The $18.7 million decrease in the net deferred tax asset was primarily attributable to changes in temporary differences during the year, including the impact of unrealized gains and losses on available for sale securities, as well as other balance sheet driven tax adjustments.
Paragraph 95 · 43% changed
10-K Feb 24, 2025
On November 1, 2013, the Corporation completed the private issuance and sale to four institutional investors of an aggregate of $70.0 million of debt comprised of (a) 5.00 percent Fixed-to-Floating Rate Senior Notes due 2028 in the aggregate principal amount of $5 million and (b) 6.75 percent Fixed-to-Floating Rate Subordinated Notes due October 30, 2028 in the aggregate principal amount of $65.0 million. The Corporation exercised its right to redeem $65 million of the subordinated debt on the scheduled interest payment date during the first half of 2024.
10-K Feb 25, 2026
On April 1, 2022, the Corporation assumed $30.0 million of subordinated notes in conjunction with its acquisition of Level One. On February 14, 2025, the Corporation, through its trustee, distributed notice of redemption of all $30.0 million in principal amount of its 4.75 percent Fixed-to-Floating Subordinated Notes due December 18, 2029. The Corporation exercised its right to redeem $30.0 million of the subordinated debt on the scheduled interest payment date of March 18, 2025.
Paragraph 64 · 41% changed
10-K Feb 24, 2025
Average borrowings decreased $106.5 million, or 9.6 percent, for the year ended December 31, 2024 compared to the same period of 2023. This decrease was primarily driven by decreases of $53.8 million, $35.3 million and $18.2 million in the average balance of subordinated debt, repurchase agreements and fed funds purchased, respectively. The Corporation redeemed $65.0 million of subordinated debt in the first half of 2024 which contributed to the decrease in the average balance of subordinated debt. The decreases in repurchase agreements and fed funds purchased were due primarily to the Corporation utilizing liquidity to pay down borrowings in 2024.
10-K Feb 25, 2026
Average borrowings increased $133.7 million, or 13.3 percent, for the year ended December 31, 2025 compared to the same period of 2024. This increase was primarily driven by increases of $140.7 million and $38.9 million in the average balance of FHLB advances and federal funds purchased, respectively. Partially offsetting these increases was a $35.5 million decrease in the average balance of subordinated debt, reflecting the Corporation’s redemption of $30.0 million in the first quarter of 2025 and the redemption of $5.0 million of Senior Debt in the third quarter of 2025. The increase in borrowings supported loan growth and helped manage the funding mix while prudently optimizing the Corporation’s overall cost of funds.
Paragraph 23 · 40% changed
10-K Feb 24, 2025
The Corporation’s tax asset, deferred and receivable decreased from $99.9 million at December 31, 2023 to $92.4 million at December 31, 2024. The $7.5 million decrease was a combination of the Corporation’s net deferred tax asset increasing from $84.7 million at December 31, 2023 to $85.9 million at December 31, 2024, and the income tax receivable decreasing from $15.2 million at December 31, 2023 to $6.5 million at December 31, 2024.
10-K Feb 25, 2026
The Corporation’s tax asset, deferred and receivable decreased from $92.4 million at December 31, 2024 to $78.7 million at December 31, 2025, which included the Corporation’s net deferred tax asset decreasing from $85.9 million at December 31, 2024 to $67.2 million at December 31, 2025. The $18.7 million decrease in the Corporation’s net deferred tax asset was primarily attributable to changes in temporary differences, including the impact of unrealized gains and losses on available‑for‑sale securities, as well as other balance sheet‑driven items during the year.
A paragraph is matched with the one last year that shares the most of its words; under half in common makes it new. The paragraphs shown are the 5 reworded the most in each section.
The paragraph that changed most in each section
The redline
Marked against last year's 10-K: cut words struck through, new words highlighted.
MD&A403 words changed in this paragraph; it is 30% similar to last year's version.
Source: Item 7, 10-K 0000712534-26-000022 vs Item 7, 10-K 0000712534-25-000058
Accounting Policies229 words changed in this paragraph; it is 38% similar to last year's version.
The ACL - Investments is a contra asset-valuation account that is deducted from the amortized cost basis of investment securities held to maturity to present the net amount expected to be collected. Investment securities held to maturity are charged off against the ACL - Investments when deemed uncollectible. Adjustments to the ACL - Investments are reported in the income statement as a component of the provision for credit loss. The Corporation measures expected credit losses on held to maturity debt securities on a collective basis by major security type with each type sharing similar risk characteristics, and considers historical credit loss information that is adjusted for current conditions and reasonable and supportable forecasts. The Corporation has made the accounting policy election to exclude accrued interest receivable on investment securities held to maturity from the estimate of credit losses. With regard to U.S. Government-sponsored agency and mortgage-backed securities, all these securities are issued by a U.S. government-sponsored entity and have an implicit or explicit government guarantee. With regard to securities issued by states and municipalities and other investment securities held to maturity, management considers (1) issuer bond ratings, (2) the financial condition of the issuer, (3) historical loss rates for given bond ratings, and (4) whether issuers continue to make timely principal and interest payments under the contractual terms of the securities. Historical loss rates associated with securities having similar grades as those in the Corporation’s portfolio have generally not been significant. An allowance for credit losses of $245,000 was recorded on state and municipal securities classified as held to maturity based on applying the long-term historical credit loss rate, as published by Moody’s, for similarly rated securities. Details of the Corporation’s ACL - Investments are included in NOTE 4. INVESTMENT SECURITIES of these Notes to Consolidated Financial Statements.
Source: Item 8, Note 1 – NATURE OF OPERATIONS AND SUMMARY OF SIGNIFICANT ACCOUNTING POLICIES, 10-K 0000712534-26-000022 vs Item 8, Note 1 – NATURE OF OPERATIONS AND SUMMARY OF SIGNIFICANT ACCOUNTING POLICIES, 10-K 0000712534-25-000058
Risk Factors105 words changed in this paragraph; it is 80% similar to last year's version.
The global business community has increased continued its political and social awareness surrounding the state of the global environment and the issue of climate change. Further, the U.S. Congress, state legislatures and federal and state regulatory agencies continue to propose numerous initiatives related to climate change. Similar and even more expansive initiatives At the same time, some policymakers have adopted or are expected under the current administration, including potentially increasing supervisory expectations with respect to banks’ risk management practices, accounting for the effects of considering adopting, requirements that constrain climate change in stress testing scenarios and systemic risk assessments, revising expectations for credit portfolio concentrations based on climate-related factors and encouraging investment by banks in climate-related initiatives and lending to communities disproportionately impacted by the effects of climate change. initiatives. The lack of empirical data legislative or regulatory certainty surrounding the credit climate risk management and other financial risks posed by climate change practices make it impossible to predict how specifically climate change may impact our financial condition and results of operations. To the extent our customers experience unpredictable and more frequent weather disasters attributed to climate change, the value of real property securing the loans in our portfolios may be negatively impacted. Additionally, if insurance obtained by our borrowers is insufficient to cover any disaster-related losses sustained to the collateral, or if insurance coverage is otherwise unavailable to our borrowers, the collateral securing our loans may be negatively impacted by climate change, which could impact our financial condition and results of operations. Further, the effects of weather disasters attributed to climate change may negatively impact regional and local economic activity, which could lead to an adverse effect on our customers and impact the communities in which we operate. Overall, climate change, its effects and the resulting, unknown impact could have a material adverse effect on our financial condition and results of operations.
Source: Item 1A, 10-K 0000712534-26-000022 vs Item 1A, 10-K 0000712534-25-000058
Sentences and paragraphs added, removed or reworded
Every change, by type
Sentences and paragraphs of FRME's Risk Factors and MD&A, 10-K Feb 25, 2026 against 10-K Feb 24, 2025. Each links to the text at sec.gov.
Quiet changes are sentences kept from last year with one to four words changed, at least one of them a hedge, a modal or a qualifier (may, could, will, not, significant, material…). A year or date rolling forward is not counted.
The full word list
adverse, adversely, all, although, anticipate, anticipates, any, approximately, believe, believes, can, cannot, certain, could, expect, expects, generally, however, if, intend, intends, largely, likely, many, material, materially, may, might, most, must, never, no, not, possible, primarily, probable, should, significant, significantly, some, substantial, substantially, unlikely, will, would
AddedRisk Factors
infectious disease outbreak may include decreased interest rates, which could adversely impact the Corporation’s interest margins and may lead to decreases in the Corporation’s net interest income.
Read it in 10-K Feb 25, 2026 at sec.gov
AddedRisk Factors
•The Corporation is subject to risks and challenges related to its development and use of artificial intelligence.
Read it in 10-K Feb 25, 2026 at sec.gov
AddedRisk Factors
The Corporation and its third-party vendors, clients, counterparties, and other market participants use and develop artificial intelligence technologies, including machine-learning and generative artificial intelligence tools, and generative artificial intelligence models. This use may expose the Corporation to various risks and potential liabilities, including: enhanced governmental or regulatory scrutiny; litigation; ethical concerns; confidentiality and security risks; intellectual property concerns over data rights and protection; heightened susceptibility to, and increased frequency and severity of, cyberattacks; inaccurate or biased algorithms or underlying datasets; and misuse or misappropriation. These factors could adversely affect our business, reputation, and financial results. In addition, poor implementation of artificial intelligence by the Corporation or its third-party service providers could subject the Corporation to additional risks that we may not adequately predict or mitigate.
Read it in 10-K Feb 25, 2026 at sec.gov
AddedRisk Factors
Failure to strategically embrace artificial intelligence or to achieve expected effectiveness, productivity, or cost reductions from artificial intelligence adoption may result in a competitive disadvantage. We could experience a material adverse effect on our operating results, customer relationships, and growth opportunities if: we cannot offer new artificial intelligence-facilitated technologies as quickly as our competitors; our competitors develop more cost-effective solutions or product offerings; our employees do not adopt such technologies expediently; or we are unable to source necessary components, including reliable third-party technology solutions and service providers. The use of artificial intelligence solutions may also introduce operational and control risks, including potential errors in outputs, challenges in oversight and accountability, increased vulnerability to system failures or cyber incidents, and the risk that these technologies may not perform as intended under complex or unforeseen circumstances. These risks could materially disrupt our business operations and adversely affect our financial condition and reputation.
Read it in 10-K Feb 25, 2026 at sec.gov
AddedRisk Factors
The evolving legal, regulatory, and compliance framework for artificial intelligence, both in the U.S. and internationally, may impact our ability to protect our data and intellectual property against infringing use, require changes to our artificial intelligence implementation, and increase our compliance costs and the risk of non-compliance. Although the Corporation has established governance, risk management, and control frameworks intended to oversee the use of artificial intelligence, these frameworks may not identify or mitigate all current or emerging risks associated with rapidly evolving technologies. Additionally, we may not be able to control how third-party artificial intelligence solutions we use are developed or maintained, including the source and quality of training data or the frequency and nature of model updates. We may also be unable to govern or protect the integrity of the data we input into such tools, specifically how that data is retained, reused, co-mingled with other data, or disclosed, even where we have sought protections with respect to these matters.
Read it in 10-K Feb 25, 2026 at sec.gov
RewordedRisk Factors
Moreover, governmental and regulatory actions taken in response to an epidemic, a pandemic or another infectious disease outbreak may include decreased interest rates, which could adversely impact the Corporation’s interest margins and may lead to decreases in the Corporation’s net interest income.
Read it in 10-K Feb 25, 2026 at sec.gov
RewordedRisk Factors
The lack of empirical data legislative or regulatory certainty surrounding the credit climate risk management and other financial risks posed by climate change practices make it impossible to predict how specifically climate change may impact our financial condition and results of operations.
Read it in 10-K Feb 25, 2026 at sec.gov
RewordedRisk Factors
Show the other 30
RewordedRisk Factors
In response to easing inflation pressures, the Federal Reserve is expected to decrease decreased the target federal funds rate in 2025. 2024 and 2025, but uncertainty remains concerning inflation and interest rates.
Read it in 10-K Feb 25, 2026 at sec.gov
RewordedRisk Factors
Although the Corporation adheres to industry standard practices in conducting thorough due diligence of vendors and contract management, should a vendor experience a breach, similar to the MOVEit breach in 2023 which impacted a vendor utilized by the Bank, the Bank could still suffer reputational harm, and potentially financial losses.
Read it in 10-K Feb 25, 2026 at sec.gov
RewordedRisk Factors
The Corporation’s third-party management program Third-Party Risk Management Program helps to mitigate risks posed by reliance on third and fourth parties.
Read it in 10-K Feb 25, 2026 at sec.gov
RewordedRisk Factors
Sources also include brokered certificates of deposit, repurchase agreements, federal funds purchased and FHLB Federal Home Loan Bank (“FHLB”) advances.
Read it in 10-K Feb 25, 2026 at sec.gov
AddedMD&A
On February 1, 2026, the Corporation completed the acquisition of First Savings Financial Group, Inc., an Indiana corporation (“First Savings”), pursuant to the Agreement and Plan of Merger, dated as of September 24, 2025, by and between the Corporation and First Savings (the “Merger Agreement”). Immediately following the Merger, First Savings Bank, a wholly-owned subsidiary of First Savings, merged with and into the Bank with the Bank surviving the merger and continuing its corporate existence.
Read it in 10-K Feb 25, 2026 at sec.gov
AddedMD&A
First Savings was headquartered in Jeffersonville, Indiana and had 16 banking centers serving the southern Indiana market and had total assets of $2.4 billion (unaudited), total loans of $1.9 billion (unaudited), and total deposits of $1.7 billion (unaudited) as of December 31, 2025. The Corporation engaged in this transaction with the objective that the transaction would be accretive to earnings and add to the existing market area in Indiana that has a demographic profile consistent with many of the current Midwest markets served by the Bank. For the year ended December 31, 2025, the Corporation recorded merger-related expenses of $0.8 million related to the First Savings acquisition.
Read it in 10-K Feb 25, 2026 at sec.gov
AddedMD&A
The table below includes certain financial data of the Corporation for the previous 3 years:
Read it in 10-K Feb 25, 2026 at sec.gov
AddedMD&A
(Dollars in Thousands, Except Share Data) December 31, 2025 2024 2023 Income Statement: Net interest income $ 536,013 $ 521,114 $ 545,400 Provision for credit losses 21,250 35,700 3,500 Noninterest income 126,934 125,580 105,602 Noninterest expense 382,583 379,266 388,270 Net income available to common stockholders 224,126 199,527 221,911 Per Share Data: Average diluted common shares outstanding (in thousands) 57,726 58,533 59,489 Diluted net income available to common stockholders $ 3.88 $ 3.41 $ 3.73 Cash dividends paid to common stockholders 1.43 1.39 1.34 Common dividend payout ratio (1) 36.86 % 40.76 % 35.92 % Book value per share $ 42.87 $ 39.33 $ 37.40 Tangible common book value per share (2) 30.18 26.78 25.06 Performance Ratios: Return on average assets 1.21 % 1.09 % 1.23 % Return on average stockholders' equity 9.43 8.86 10.43 Return on tangible common stockholders' equity (2) 14.08 13.71 16.76 Net interest margin (FTE) (3) 3.25 3.19 3.35 Efficiency ratio (2) 54.54 53.55 55.17 Net charge-offs as % of average loans 0.14 0.39 0.21 Allowance for credit losses - loans as % of total loans 1.42 1.50 1.64 Nonperforming assets / total assets % 0.38 0.43 0.32 Balance Sheet: Total securities $ 3,378,641 $ 3,460,695 $ 3,811,364 Total loans 13,811,786 12,873,022 12,504,961 Total assets 19,025,101 18,311,969 18,405,887 Total deposits 15,294,855 14,521,626 14,821,453 Total borrowings 999,934 1,158,185 1,028,776 Total stockholders' equity 2,466,667 2,304,983 2,247,713 Capital Ratios: Total stockholders' equity to assets 12.97 % 12.59 % 12.21 % Tangible common stockholders' equity to tangible assets (2) 9.38 8.81 8.40 Total risk-based capital to risk-weighted assets 13.41 13.31 13.67 Tier 1 capital to risk-weighted assets 11.86 11.59 11.52 Common equity tier 1 capital to risk-weighted assets 11.70 11.43 11.35 Tier 1 capital to average assets 10.24 9.96 9.64 (1) Cash dividends paid per common share divided by diluted net income per common share. (2) Non-GAAP financial measures. Refer to the "Non-GAAP Financial Measures" section for reconciliations to GAAP financial measures. (3) Calculated using a marginal tax rate of 21 percent for all periods.
Read it in 10-K Feb 25, 2026 at sec.gov
AddedMD&A
EFFICIENCY RATIO (NON-GAAP) (Dollars In Thousands) Years Ended December 31, 2025 December 31, 2024 December 31, 2023 Noninterest expense (GAAP) $382,583 $379,266 $388,270 Less: Intangible asset amortization (6,028) (7,271) (8,743) Less: Other real estate owned and foreclosure expense (1,525) (2,076) (3,318) Adjusted noninterest expense (non-GAAP) $375,030 $369,919 $376,209 Net interest income (GAAP) $536,013 $521,114 $545,400 Plus: Fully taxable equivalent adjustment 24,720 23,326 23,943 Net interest income on a fully taxable equivalent basis (non-GAAP) $560,733 $544,440 $569,343 Noninterest income (GAAP) $126,934 $125,580 $105,602 Less: Investment securities losses 8 20,757 6,930 Adjusted noninterest income (non-GAAP) $126,942 $146,337 $112,532 Adjusted revenue (non-GAAP) $687,675 $690,777 $681,875 Efficiency ratio (non-GAAP) 54.54% 53.55% 55.17%
Read it in 10-K Feb 25, 2026 at sec.gov
AddedMD&A
Noninterest expense increased $3.3 million, or 0.9 percent, to $382.6 million for the year ended December 31, 2025, primarily due to increases of $3.9 million in salaries and employee benefits and $1.8 million in equipment expense compared to 2024. These increases were partially offset by a decrease of $1.6 million in FDIC assessments, driven by a reduction of the special assessment accrual originally recorded in the first quarter of 2024 following the 2023 bank failures and a $1.2 million decrease in intangible assets amortization.
Read it in 10-K Feb 25, 2026 at sec.gov
AddedMD&A
Net charge-offs totaling $18.4 million, $49.4 million, and $25.6 million were recognized for the years ended December 31, 2025, 2024, and 2023, respectively. The distribution of the net charge-offs (recoveries) for the twelve months ended December 31, 2025, 2024, and 2023 is reflected in the following table.
Read it in 10-K Feb 25, 2026 at sec.gov
RemovedMD&A
RemovedMD&A
RemovedMD&A
RemovedMD&A
RemovedMD&A
RemovedMD&A
RemovedMD&A
RewordedMD&A
RewordedMD&A
DILUTED TANGIBLE EARNINGS NET INCOME PER COMMON SHARE, RETURN ON AVERAGE TANGIBLE ASSETS AND RETURN ON AVERAGE TANGIBLE COMMON STOCKHOLDERS' EQUITY - non-GAAP (NON-GAAP) (Dollars in thousands, except per share amounts) Thousands, Except Per Share Amounts) December 31, 2025 December 31, 2024 December 31, 2023 December 31, 2022 Average goodwill (GAAP) $ 712,002 $ 712,002 $ 671,485 712,002 Average other intangibles (GAAP) 16,806 23,298 31,331 35,885 Average deferred tax on other intangibles (GAAP) (3,615) (5,005) (6,731) (7,567) Intangible adjustment (non-GAAP) $ 725,193 $ 730,295 $ 736,602 $ 699,803 Average stockholders' equity (GAAP) $ 2,375,500 $ 2,252,491 $ 2,127,262 $ 1,972,445 Average preferred stock (GAAP) (25,125) (25,125) (18,875) (25,125) Intangible adjustment (non-GAAP) (725,193) (730,295) (736,602) (699,803) Average tangible capital common stockholders' equity (non-GAAP) $ 1,625,182 $ 1,497,071 $ 1,365,535 $ 1,253,767 Average assets (GAAP) $ 18,633,952 $ 18,400,495 $ 18,186,507 $ 17,220,002 Intangible adjustment (non-GAAP) (725,193) (730,295) (736,602) (699,803) Average tangible assets (non-GAAP) $ 17,908,759 $ 17,670,200 $ 17,449,905 $ 16,520,199 Net income available to common stockholders (GAAP) $ 224,126 $ 199,527 $ 221,911 $ 220,683 Other intangible amortization, net of tax (GAAP) 4,762 5,744 6,907 6,537 Preferred stock dividend 1,875 1,875 1,406 Tangible net income available to common stockholders (non-GAAP) 228,888 205,271 228,818 Preferred stock dividend 1,875 1,875 1,875 Tangible net income (non-GAAP) $ 230,763 $ 207,146 $ 230,693 $ 228,626 Per Share Data:
Read it in 10-K Feb 25, 2026 at sec.gov
RewordedMD&A
PPP loan income — — (49) (3,207) Net realized losses/(gains) losses on sales of available for sale securities 8 20,757 6,930 (1,194) Gain on branch sale — (19,983) — — Acquisition-related expenses 800 — — 16,531 Acquisition-related provision expense — — 16,755 Non-core expenses 1,2 (1),(2),(3) (110) 4,243 12,682 — Tax on adjustments (169) (1,229) (4,767) (7,084) Adjusted Net Income Available net income available to Common Stockholders - non-GAAP common stockholders (non-GAAP) $ 224,655 $ 203,315 $ 236,707 $ 242,484 Average Diluted Common Shares Outstanding diluted common shares outstanding (in thousands) 57,726 58,533 59,489 57,950 Diluted Earnings Per Common Share - GAAP earnings per common share (GAAP) $ 3.88 $ 3.41 $ 3.73 $ 3.81 Adjustments:
Read it in 10-K Feb 25, 2026 at sec.gov
RewordedMD&A
Balances, December 31 January 1 $ 192,757 $ 204,934 $ 223,277 $ 195,397 Loans charged off (24,221) (54,243) (28,039) (6,601) Recoveries on loans 5,811 4,866 2,396 3,927 Net charge-offs (18,410) (49,377) (25,643) (2,674) Provision for credit losses - loans 21,250 37,200 7,300 — CECL Day 1 non-PCD provision for credit losses - loans — — 13,955 CECL Day 1 PCD ACL - loans — — 16,599 Ending balance, Balances, December 31 $ 195,597 $ 192,757 $ 204,934 $ 223,277 Ratio of net charge-offs during the period to average loans outstanding during the period 0.14 % 0.39 % 0.21 % 0.02 % Ratio of allowance for credit losses - loans to nonaccrual loans 272.5 % 261.3 % 382.5 % 527.5 % Ratio of allowance for credit losses - loans to total loans outstanding 1.42 % 1.50 % 1.64 % 1.86 %
Read it in 10-K Feb 25, 2026 at sec.gov
RewordedMD&A
RewordedMD&A
Demand deposits $ 7,770,473 $ 7,980,061 $ 7,965,862 Savings deposits 5,481,785 4,522,758 4,516,433 Certificates and other time deposits of $100,000 or less 603,690 692,068 Certificates and other time deposits of $100,000 or more 915,293 1,043,068 1,408,985 Other certificates and time deposits 692,068 849,906 Brokered certificates of deposits 523,614 283,671 80,267 Total deposits 15,294,855 14,521,626 14,821,453 Federal funds purchased 40,000 99,226 — Securities sold under repurchase agreements 103,755 142,876 157,280 Federal Home Loan Bank advances 798,549 822,554 712,852 Subordinated debentures and term loans 57,630 93,529 158,644 $ 16,294,789 $ 15,679,811 $ 15,850,229
Read it in 10-K Feb 25, 2026 at sec.gov
RewordedMD&A
RewordedMD&A
Payments Due In (Dollars in Thousands) One Year or Less Over One Year Total Deposits without stated maturity $ 12,502,819 13,252,258 $ — $ 12,502,819 13,252,258 Certificates and other time deposits 1,746,640 272,167 2,018,807 1,747,870 294,727 2,042,597 Securities sold under repurchase agreements 142,876 103,755 — 142,876 103,755 Federal Home Loan Bank advances 95,000 727,554 822,554 75,000 723,549 798,549 Federal Funds Purchased 99,226 40,000 — 99,226 40,000 Subordinated debentures and term loans 1,333 92,196 93,529 other borrowings 1,293 56,337 57,630 Total $ 14,587,894 15,220,176 $ 1,091,917 1,074,613 $ 15,679,811 16,294,789
Read it in 10-K Feb 25, 2026 at sec.gov
RewordedMD&A
RewordedMD&A
Under the fully phased-in Basel III requires capital rules, the Corporation and the Bank are required to maintain the minimum capital and leverage ratios as defined in the regulation and ratios, including a 2.5 percent capital conservation buffer, as illustrated in the table below, which capital to risk-weighted asset ratios include a 2.5 percent capital conservation buffer. below.
Read it in 10-K Feb 25, 2026 at sec.gov
RewordedMD&A
At December 31, 2024, non-accrual 2025, nonaccrual loans totaled $73.8 $71.8 million, an increase a decrease of $20.2 $2.0 million from December 31, 2023, 2024, primarily due to a $24.1 an $11.3 million, $2.1 million increase and $0.8 million decrease in non-accrual nonaccrual balances within the commercial real estate, non-owner occupied, construction and home equity loan class. classes, respectively.
Read it in 10-K Feb 25, 2026 at sec.gov
RewordedMD&A
Nonaccrual loans as of December 31, 2024 2025 totaled $73.8 $71.8 million, an increase a decrease of $20.2 $2.0 million from December 31, 2023, 2024, primarily due to a $24.1 an $11.3 million, $2.1 million increase and $0.8 million decrease in non-accrual nonaccrual balances within the commercial real estate, non-owner occupied, construction and home equity loan class. classes, respectively.
Read it in 10-K Feb 25, 2026 at sec.gov
Sources
The two latest 10-Ks on EDGAR, section by section. Each change links to the text at sec.gov.
Also
New risk factors: paragraphs with nothing like them last year, quoted in full.
Work with it
Excel workbook · CSV. Google Sheet that stays up to date: paste =IMPORTDATA("https://tickdelta.com/company/FRME/export.csv") into a cell.