FSLRFirst Solar
We are America’s leading PV solar technology and manufacturing company. 10-K, Item 1
- Employees
- 7,900
- Headquarters
- Phoenix, AZ
- CEO
- Mark R. Widmar
- Next results
- around Feb 23, 2027
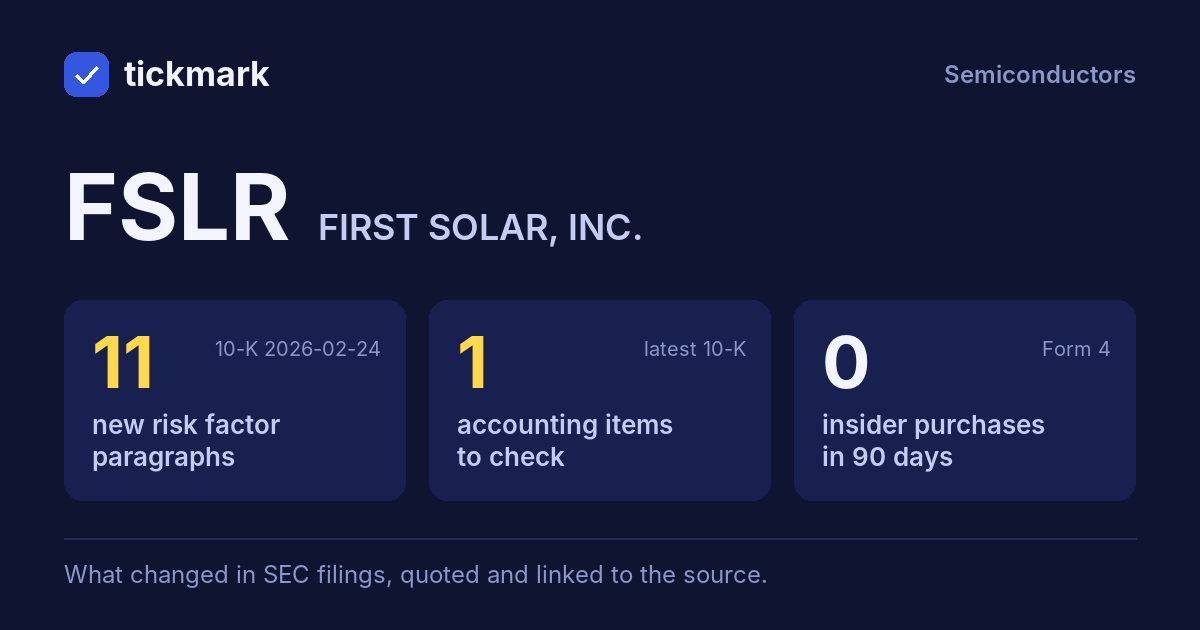
Facts from the latest 10-K that are worth reading about. They are not a verdict on the company.
Ratios over five years
Each ratio is worked out from the 10-K's own numbers; hover a value for its source. The small grey figure under each value (“peers”) is the median of 9 companies in the same peer group, for the same fiscal year. The line at the right shows the company (solid) against the peer median (dashed) on one scale. A ratio that moves is a reason to read the filing, not a verdict.
| Ratio | FY2021 | FY2022 | FY2023 | FY2024 | FY2025 | Trend |
|---|---|---|---|---|---|---|
| Days of sales in receivables Receivables / revenue x 365 How long customers take to pay. A rise means sales are being booked faster than cash arrives. | 54 peers 69 | 45 peers 63 | 73 peers 63 | 109 peers 61 | 90 peers 63 | |
| Days of inventory Inventory / cost of revenue x 365 How long stock sits before it is sold. A rise can mean slowing demand, or stock that may need writing down. | 111 peers 59 | 89 peers 92 | 148 peers 99 | 169 peers 93 | 87 peers 99 | |
| Gross margin (Revenue - cost of revenue) / revenue What is left of each sales dollar after the direct cost of the goods or services. | 25.0% peers 68.2% | 2.7% peers 67.5% | 39.2% peers 68.2% | 44.2% peers 68.4% | 40.6% peers 58.9% | |
| Cash from operations / net income Cash from operations / net income (only when net income is above zero) Near or above 1.0x means profit arrives as cash. Well below it for years means profit is sitting in receivables, stock or estimates. | 0.51x peers 2.16x | - peers 2.21x | 0.72x peers 1.74x | 0.94x peers 2.27x | 1.35x peers 1.90x | |
| Accruals ratio (Net income - cash from operations) / average total assets The part of profit that is not cash, as a share of the balance sheet. Higher means more of the profit rests on accounting estimates. | 3.2% peers −9.5% | −11.7% peers −9.3% | 2.5% peers −8.6% | 0.7% peers −9.2% | −4.2% peers −7.3% | |
| SG&A / revenue Selling, general and administrative expense / revenue Overhead per dollar of sales. A sudden fall can come from cutting costs, or from moving costs elsewhere. | 5.8% peers 11.0% | 6.3% peers 12.3% | 6.0% peers 9.5% | 4.5% peers 12.2% | 3.9% peers 11.0% |
Published score, FY2025
Academic formulas, worked out from this company's 10-K numbers. They describe a pattern in the figures; they do not say what the company did, and they are not a view on the shares. Every input is a line item from the filing.
One point for each test the company passes. The paper used it on low price-to-book companies; here it is shown as a summary of the year's financial direction.
The tests
| Return on assets is positiveNet income / assets at the start of the year, above zero. | ✓ 1 |
|---|---|
| Cash from operations is positiveOperating cash flow above zero. | ✓ 1 |
| Return on assets roseThis year's return on assets above last year's. | ✓ 1 |
| Cash from operations exceeds net incomeOperating cash flow / assets above return on assets. | ✓ 1 |
| Long-term debt fell relative to assetsLong-term debt / average assets lower than last year. | ✓ 1 |
| Current ratio roseCurrent assets / current liabilities above last year's. | ✓ 1 |
| No new shares issuedDiluted share count not above last year's (the paper tests for an equity offering). | ✓ 1 |
| Gross margin rose(Revenue - cost of revenue) / revenue above last year's. | – 0 |
| Asset turnover roseRevenue / assets at the start of the year above last year's. | ✓ 1 |
What it does not mean: a low score is not a prediction of a fall, and a high score is not a reason to buy. A test the XBRL could not support is shown as n/a and left out of the total.
How each check works
what it measures, the threshold, what it does not mean
| Check | What it measures | When it is marked | What it does not mean |
|---|---|---|---|
| Receivables growing faster than revenue | Whether customers owe more, relative to sales, than a year ago. | Receivables grew more than 10 percentage points faster than revenue, and grew. | Not proof that revenue is overstated. A large deal at year end, longer payment terms or an acquisition can do the same. |
| Cash from operations lower than net income | Whether reported profit is backed by cash from the business. | Cash from operations is below net income. Not computed for banks and other financial companies. | Common in fast-growing or seasonal companies. It is a question to ask, not a failure. |
| Inventory growing faster than revenue | Whether stock is piling up relative to sales. | Inventory grew more than 10 percentage points faster than revenue, and grew. | May be a planned build ahead of a product launch or a supply-chain change. |
| Auditor change | Whether the company changed its auditor. | An 8-K item 4.01 in the last 2 years, or a different auditor name in the two latest 10-Ks. | Often routine: rotation, a tender, or an audit firm merger. |
| Going concern language | Whether the 10-K states substantial doubt about continuing as a going concern. | A sentence to that effect is found in the 10-K text. Quoted as filed. | The wording is the company's, not our estimate. It can also appear in a sentence saying the doubt was removed. |
| Restatement (8-K item 4.02) | Whether the company said earlier financial statements should no longer be relied on. | An 8-K item 4.02 in the last 2 years. | Some restatements are small and do not change the picture. |
| Late filing notice | Whether the company asked for more time to file a 10-K or 10-Q. | An NT 10-K or NT 10-Q in the last 2 years. | Delays can be technical and one-off. |
| Critical audit matters changed | Which topics the auditor singled out as most difficult, and whether they changed. | A matter is new in the latest 10-K compared with the one before. | A new matter shows where the auditor spent its effort, not that something is wrong. |
| Material weakness in internal control | Whether the 10-K concludes that internal control over financial reporting was not effective because of a material weakness. | A sentence in the 10-K text concludes that controls were not effective because of a material weakness, quoted as filed. Sentences that say there is none, that one could occur, or that an earlier one was fixed are not marked. | It is the company's or the auditor's own wording, not our estimate. Many are about one account or process and are fixed within a year. It does not say the numbers are wrong. |
| Material impairment (8-K item 2.06) | Whether the company told the SEC it expects a material charge for impaired assets, such as goodwill. | An 8-K item 2.06 in the last 2 years. | A non-cash write-down. It says an earlier value was too high, not that the business is failing or that cash ran out. |
| Bankruptcy (8-K item 1.03) | Whether the company filed for bankruptcy or receivership. | An 8-K item 1.03 in the last 2 years. | The filing is the company's own and is a fact. It does not say what shareholders will get or whether the business continues. |
The 10-point threshold is our choice, not an academic result. Every check cites the filing and the line items it used.
Work on FSLR in a spreadsheet:
Excel workbook (a sheet per section, ten years by column, charts, links to the filings) ·
CSV.
For a Google Sheet that stays up to date, paste =IMPORTDATA("https://tickdelta.com/company/FSLR/export.csv") into a cell.