Gulfport Energy Corp GPOR
Gulfport is an independent natural gas-weighted exploration and production company with assets primarily located in the Appalachia and Anadarko basins. 10-K, Item 1
- Headquarters
- Oklahoma City, OK
- CEO
- Domenic J. Dell'osso Jr
- Next results
- around Feb 23, 2027
Where each dollar of revenue went, FY2025
Revenue of $1.4B through the costs to a net profit of $427.8M · income statement of the 10-K
GPOR among Energy peers
Six ratios from the latest 10-K. Each corner is the share of 57 peers the company is above, not a score.
What changed
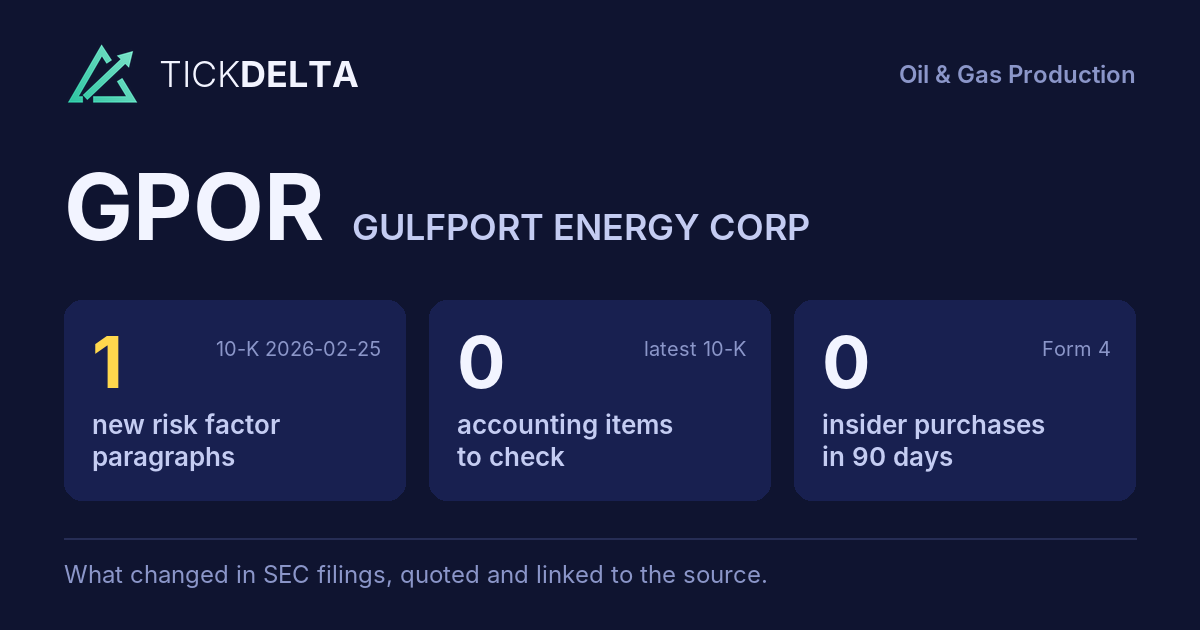
1 new risk paragraph. 10-K filed Feb 25, 2026 against Feb 26, 2025.
Each row opens the detail with the quote and the filing. A row is a change worth reading, not a verdict.
Accounting checks
9 checks on the latest 10-K. Checks, not verdicts.
0facts worth reading about all 9 checks found nothing to note
-
Receivables +18.4% ($155.9M to $184.6M) vs revenue +48.5% ($958.1M to $1.4B), -30.1 pts apart
-
Cash from operations $803.2M vs net income $427.8M (FY ending Dec 31, 2025)
-
Same auditor in both 10-Ks: GRANT THORNTON LLP
6 more checks with nothing to note
-
No statement of substantial doubt about going concern
-
No 8-K item 4.02 in the last 2 years
-
No NT 10-K or NT 10-Q in the last 2 years
-
No sentence in the 10-K concludes that controls were not effective because of a material weakness
-
No 8-K item 2.06 in the last 2 years
-
No 8-K item 1.03 in the last 2 years
In their words
1 paragraph in Risk Factors that was not in the 10-K filed Feb 26, 2025. Quoted as filed.
-
Item 1A · new paragraph · not in the 10-K filed Feb 26, 2025 10-K, ITEM 1A
In addition, the oil and gas industry is characterized by rapid technological change and the introduction of new products and services. Competitors that develop or adopt new technologies more quickly may gain a significant advantage, which could require us to incur substantial costs to remain competitive. Some industry participants have…
New risk paragraphs, against peers
Latest 10-K of each, Energy companies closest in revenue
Paragraphs in Risk Factors with nothing like them in the company's 10-K the year before. A count of text, not of risk.
Financial performance
Last 4 fiscal years · 10-K XBRL
| Metric | FY2022 | FY2023 | FY2024 | FY2025 |
|---|---|---|---|---|
| Revenue | $1.3B | $1.8B | $958.1M | $1.4B |
| Net income | $494.7M | $1.5B | −$261.4M | $427.8M |
| Operating cash flow | $739.1M | $723.2M | $650.0M | $803.2M |
Revenue, FY2015 to FY2025
Ten fiscal years, each from its own 10-K · XBRL · USD
$1.4B ▲ 48.5% in FY2025$427.8M in FY2025
Recent filings
2 filings in the last 30 days · SEC EDGAR
-
10-QNov 5, 2026Quarterly report (10-Q) period ended Sep 30, 2026
-
8-KNov 4, 2026Quarterly results, Regulation FD disclosure 8-K items 2.02, 7.01
About the company
Gulfport Energy Corp, Oklahoma City, OK · from the 10-K filed Feb 25, 2026
Gulfport is an independent natural gas-weighted exploration and production company with assets primarily located in the Appalachia and Anadarko basins. Our principal operations target the Utica and Marcellus formations in eastern Ohio and the SCOOP Woodford and Springer formations in central Oklahoma. Gulfport's Predecessor was incorporated in the State of Delaware in July 1997. Our corporate headquarters are located in Oklahoma City, Oklahoma and shares of Gulfport's common stock trade on the New York Stock Exchange (“NYSE”) under the ticker symbol “GPOR”. Our corporate strategy is focused on the economic development of our asset base in an effort to generate sustainable free cash flow.
- Headquarters
- Oklahoma City, OK
- Country
- United States
- Reports in
- USD
- Listed on
- NYSE
- Fiscal year ends
- December 31
- Last results
- Nov 4, 2026
Email alerts
Sources
The 10-K filed Feb 25, 2026 (open at SEC), compared with the 10-K filed Feb 26, 2025. Numbers from the XBRL of the 10-Ks; filings from SEC EDGAR.
Work with it: Excel workbook · CSV. Google Sheet that stays up to date: paste =IMPORTDATA("https://tickdelta.com/company/GPOR/export.csv") into a cell.