GRAIL, Inc. GRAL
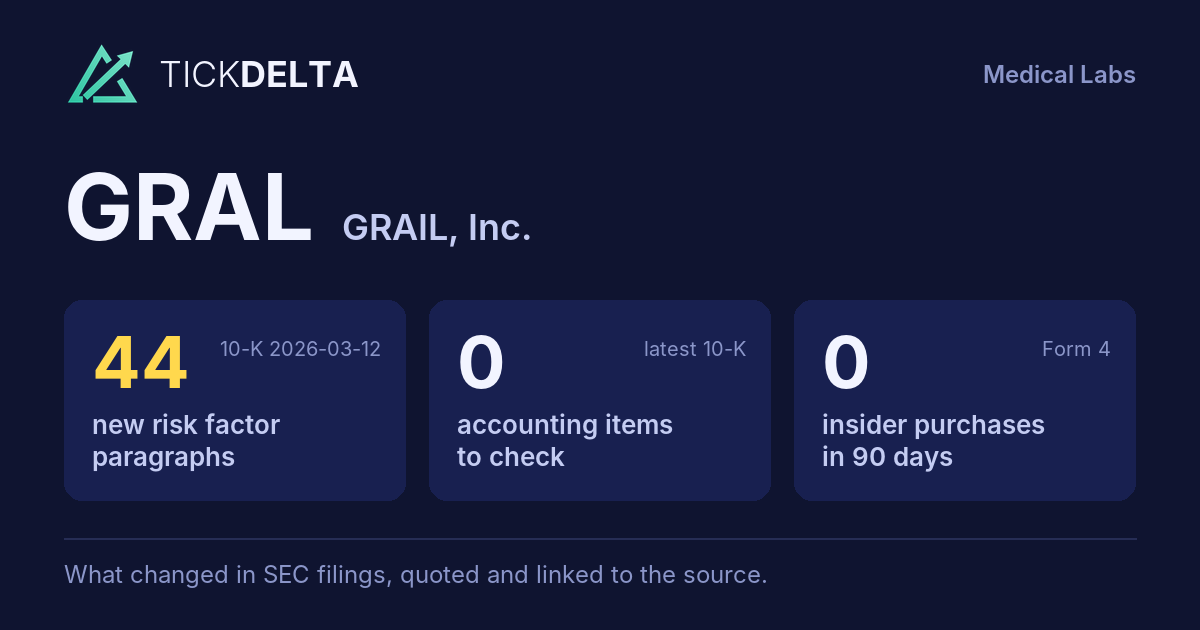
The biggest changes in the 10-K filed Mar 12, 2026, in management's words
10-K, Item 7This fiscal year against the last, and the sentences in the MD&A where management explains each change. Tickdelta picks sentences that name the line, a direction and a cause. It does not write explanations of its own.
Operating margin
Big change, FY to Dec 31, 2025 vs Dec 31, 2024
“The decrease in the research and development expenses of $126.6 million or 39% was primarily attributable to:”
Read it in the 10-K
Revenue
Big change, FY to Dec 31, 2025 vs Dec 31, 2024
“The increase in screening revenue of $30.0 million or 28% was primarily driven by a 36% increase in Galleri sales volume, partially offset by a 6% decrease in ASP.”
Read it in the 10-K
“Galleri sales volume increased in 2025 as a result of the continued ramp in our commercial activity following the release of positive study results, implementation of new pricing strategies, enhanced ordering pathways via new integrations, expansion of our partnerships with digital health platforms, and increased enrollment in our REACH/Galleri-Medicare clinical study.”
Read it in the 10-K
What management said, year by year
The cause given in each 10-K, 2 fiscal years, newest first · MD&A (Item 7)
Each bar is how the line changed that year (from the same 10-K's XBRL). Under it, the sentence in that year's MD&A that names the line, a direction and a cause, word for word. A year with no sentence says so.
Revenue
2 of 2 years explained-
FY 2025 +17.2%
“The increase in screening revenue of $30.0 million or 28% was primarily driven by a 36% increase in Galleri sales volume, partially offset by a 6% decrease in ASP.”
Read it in the FY 2025 10-K“Galleri sales volume increased in 2025 as a result of the continued ramp in our commercial activity following the release of positive study results, implementation of new pricing strategies, enhanced ordering pathways via new integrations, expansion of our partnerships with digital health platforms, and increased enrollment in our REACH/Galleri-Medicare clinical study.”
Read it in the FY 2025 10-K -
FY 2024 +34.9%
“The increase in screening revenue of $33.6 million was primarily driven by a 46% increase in Galleri sales volume, offset by a 1% decrease in average selling price (“ASP”).”
Read it in the FY 2024 10-K“The Galleri sales volume increased in 2024 as a result of the continued ramp in our commercial activity and partnerships, expansion of our network of ordering providers, increased orders from existing providers and new promotional campaigns.”
Read it in the FY 2024 10-K
Operating margin
2 of 2 years explained-
FY 2025 +1361.1 pts
“The decrease in the research and development expenses of $126.6 million or 39% was primarily attributable to:”
Read it in the FY 2025 10-K -
FY 2024 -115.4 pts
“The decrease in the research and development expenses of $16.4 million was primarily attributable to the decrease in compensation expenses and clinical studies.”
Read it in the FY 2024 10-K
Changes are computed from the XBRL figures in the same 10-K. Hover a number to see the line item. Open the 10-K
Sources
The Management's Discussion and Analysis (Item 7) of the latest 10-K, quoted word for word; the changes are computed from the same 10-K's XBRL.
Also
Financials: the numbers year by year.
Work with it
Excel workbook · CSV. Google Sheet that stays up to date: paste =IMPORTDATA("https://tickdelta.com/company/GRAL/export.csv") into a cell.